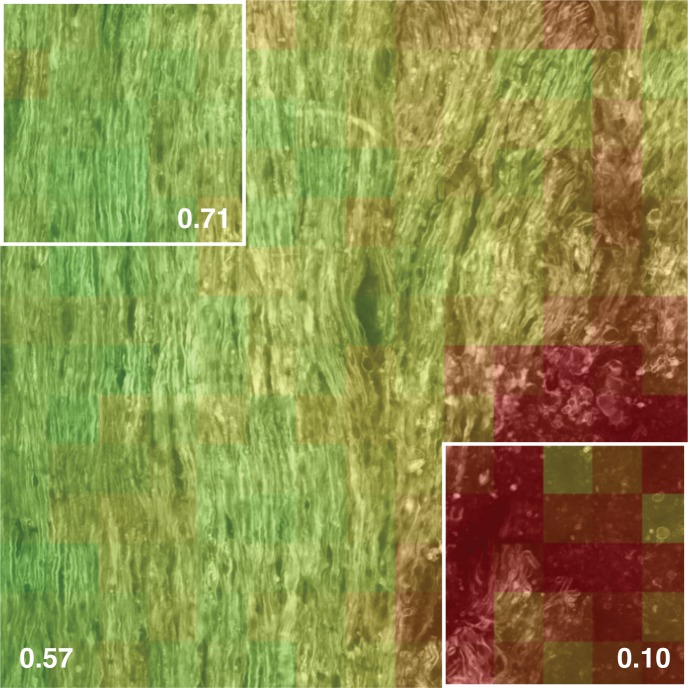
Fig. 5.
In this large map of spinal cord surface (600×600 μm), we can see that the lesions appear in patches. The difference between the median CCP of the whole image and that of the two subsections highlights the fact that the level of tissue disorganization is heterogeneous throughout the spinal cord.

