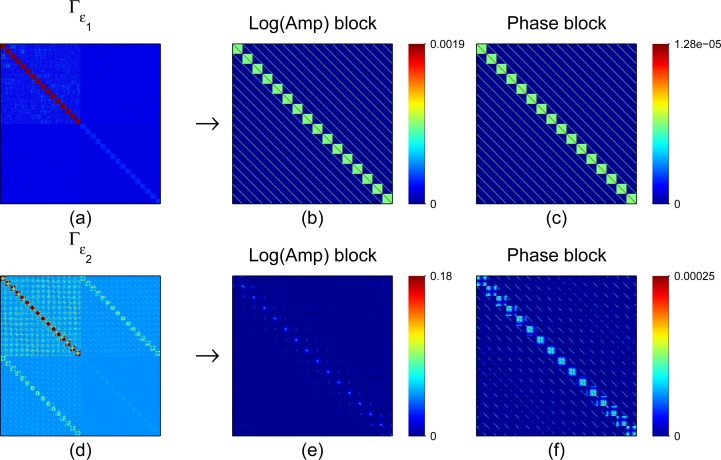
Fig. 1.
Covariance matrices for optode coupling approximation error ε 1 (top row) and optode position approximation error ε 2 (bottom row). (a) Covariance matrix of coupling coefficient errors, Γε1. (b) and (c) are Log Amplitude and Phase blocks of Γε1. (d) Covariance matrix of optode position errors, Γε2. (e) and (f) are Log Amplitude and Phase blocks of Γε2. The colors in a) and d) were scaled to highlight the different correlation structures of the approximation errors ε 1 and ε 2.

