Abstract
We report that combining interferometry with Second Harmonic Generation (SHG) microscopy provides valuable information about the relative orientation of noncentrosymmetric structures composing tissues. This is confirmed through the imaging of rat medial gastrocnemius muscle. The inteferometric Second Harmonic Generation (ISHG) images reveal that each side of the myosin filaments composing the A band of the sarcomere generates π phase shifted SHG signal which implies that the myosin proteins at each end of the filaments are oriented in opposite directions. This highlights the bipolar structural organization of the myosin filaments and shows that muscles can be considered as a periodically poled biological structure.
OCIS codes: (180.4315) Nonlinear microscopy, (190.4160) Multiharmonic generation
1. Introduction
Over the past decades, electron microscopy (EM) provided high resolution images of striated muscle. Actin and myosin filaments were identified and measured in the sarcomere [1–5]. The bipolar nature of myosin filaments, with myosin heads at each end of the filaments, was also demonstrated [2–5]. These results have revealed the structural components and the mechanisms that create motion in muscle tissue. Myosin heads at each end of myosin filaments can attach to actin filaments and pull to contract the sarcomere or release to return it to its original length. With a great number of sarcomeres, this results in muscle contraction or relaxation. A schematic representation of the sarcomere is presented at the end of this work, but a more elaborate explanation of muscle structures and its biomechanics can be found in the following references [1–7].
Since the myosin filaments have a noncentrosymmetric structural organization, muscle tissue can be imaged using Second Harmonic Generation (SHG) microscopy [6–16]. Other biological structures possess a noncentrosymmetric organization such as tissues rich in collagen type I/III proteins [14–22], collagen type 2 [22–24] and the microtubules within cells [25]. SHG microscopy is a powerful technique to image those samples as it provides sub-micron spatial resolution and is free of photobleaching as the signal arises from an organized structural arrangement lacking a center of inversion.
The myosin proteins forming each end of the filaments in the sarcomere are identical except for a relative orientation difference of 180° that is responsible for the bipolar structural organization of the A band [2–7]. Since their polarity are opposite relatively to each other, they emit a π phase shifted SHG signal [26]. This is because the sign of their achiral second order nonlinear optical susceptibility (χ (2)) tensors are inversed. However, this phase difference in the SHG cannot be detected since standard SHG microscopy only measures the signal intensity. By measuring the phase of the SHG at each pixel in the image, it should be possible to highlight the relative orientation between the noncentrosymmetric structures composing the myosin filaments.
With ISHG microscopy, a technique combining interferometry and SHG microscopy, it is possible to measure the phase of the SHG signal. This technique has been used to image noncentrosymmetric materials such as periodically poled crystals [27], organic crystals [28] and Beta Barium Borate microscrystals [29], but it has not been used to its full potential in biological tissues. Another technique named SHG holographic microscopy is capable of retrieving the SHG phase in the images [30–32]. This technique has not been exploited yet to map the relative orientation of noncentrosymmetric structures in tissues.
In the present study, we show that the bipolar structural organization of the A band can be imaged with ISHG microscopy. In comparison to standard SHG microscopy, ISHG provides additional information about the structural organization of tissues by imaging the relative orientation between noncentrosymmetric tissue structures. Myosin filaments in skeletal muscle are ideal structures to demonstrate the potential of ISHG microscopy because they form polar domains which can be imaged with sub-micron spatial resolution.
2. Method
2.1 Experimental setup
The ISHG microscope consists of an interferometer combined with a standard SHG microscope such as the setup presented in Fig. 1(a) . A laser source (Vanguard, Spectra Physics, Santa Clara, USA) operating at 1064 nm and 80 MHz emitting pulses with ~15 ps duration was used to have a strong enough SHG signal while maintaining a good temporal overlap for interference. The average power was adjusted to 50 mW in the sample with a half waveplate and a polarizer. The first step consisted of focusing the laser beam with a lens in a 350 μm thick polished Y-cut quartz crystal to generate a low power SHG reference beam. This reference beam interferes with the SHG generated by the sample downstream. Its power was adjusted by moving the interface of the quartz crystal close to or away from the focal spot of the lens with a translation stage. A metallic curved achromatic mirror was used to collimate the laser beam and the reference SHG. They passed through a 1.5 mm thick BK7 glass window mounted on a rotation stage. The laser beam and the reference SHG formed the two arms of the interferometer. Upon rotating the BK7 glass window, the two beams remained collinear allowing the precise adjustment of the phase delay between them [33,34]. The beams were sent directly at the back aperture of the illumination microscope objective rather than going through a galvanometric mirrors scanning system. Scanning was performed by moving the sample with a translation stage. This maintains the beams’ phase relation and their collinearity which grants a large field of view and simplifies image interpretation at the cost of image acquisition speed. The pixel dwell time used was 25 μs, but because of the time required for the sample scanning stage to accelerate and decelerate, a few minutes were required to obtain an image. This means it took a few hours to fully characterize a scanned area since many images were required. The illumination microscope objective had a numerical aperture (NA) of 0.85 and a condenser with a 0.55 NA was used for signal collection. The laser beam generated a SHG signal from the sample. The reference SHG signal interfered with the sample SHG. Two optical filters (FF01-720/SP-25 and FF01-530/11-25, Semrock, Rochester, USA) were used to isolate the SHG signal. An analyzer (polarizer) was placed just before the photomultiplier tube detector (R6357, Hamamatsu Photonics, Hamamatsu, Japan).
Fig. 1.
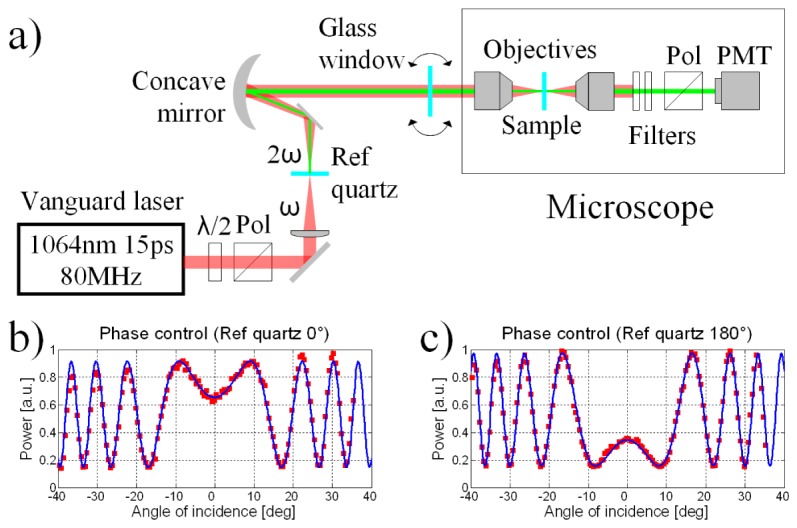
(a) The experimental setup can take interferometric or standard SHG images. (b) The reference quartz SHG interferes with the SHG of a sample quartz. The SHG signal intensity depends of the glass window angle. (c) Rotating the 350 µm thick reference quartz by 180° along the light propagation axis flips its χ (2) and inverts the interference.
The three conditions required to obtain interference are spatial overlap, temporal overlap, and identical polarization. With a collinear setup, the laser beam and the reference SHG propagate collinearly ensuring the spatial overlap of the reference SHG with the sample SHG signal. With femtosecond pulses, additional optical components would be required to compensate for the temporal delay between the laser pulses at ω and the reference SHG pulses at 2ω due to the group velocity dispersion. The picosecond laser source allows the use of a simple and robust interferometer configuration with a good temporal overlap between the laser and the reference SHG beams thus ensuring good temporal overlap. The analyzer ensures that only the SHG with a specific polarization component reaches the detector. Thus, the modulations in the interference of the measured SHG signal are maximized compared to the background SHG (Iref + Iexp), which is necessary to obtain images with a high level of interferometric contrast.
The intensity of the signal measured at every position within the scanned area in the sample is given by:
| (1) |
The argument of the cosine expression will be referred to as the interferometric contrast. It contains the phase of the sample SHG, (φexp). It is the phase required to get information on the relative orientation between protein structures generating SHG. Rotating the BK7 glass window changes the relative phase difference between the SHG generated in the reference quartz (φref) and the SHG generated in the sample (φexp). To interpolate the value of the sample SHG phase φexp at every pixel in an image, the dependence of φref on the glass window angle must be known. This dependence was measured by using another quartz crystal as the sample placed in the focus of the microscope objective. For an arbitrary window angle, φref was assigned a zero value since only the relative phase is relevant here. The SHG was measured at window angles around this point and an interference curve like the one shown in Fig. 1(b) was obtained [33,34]. With this curve, the window could be rotated at different angles to precisely control φref over a range exceeding two cycles which was more than enough for the experiment. Note that rotating the reference quartz by 180° along the light propagation axis inverses the sign of its χ (2) and changes the interference in the obtained curve, as shown in Fig. 1(c).
To extract the interferometric contrast from the raw images taken with the ISHG microscope and to eliminate the background SHG (Iref + Iexp), two raw images taken at π phase shifted reference phases are subtracted:
| (2) |
The background SHG (Iref + Iexp) is eliminated and the interferometric contrast is doubled which increases the contrast obtained in the calculated image. A positive signal is presented on a green scale while a negative signal is presented on a red scale. This way, the χ (2) domains are clearly delimited directly in the calculated image. The acquisition of numerous pairs of ISHG raw images at different reference phase values (φref) must be performed in order to interpolate the amplitude and phase of the interferometric contrast in the whole image. This provides a relative value for the phase (φexp) at all the pixels in the image. Images obtained previously in a periodically poled lithium niobate crystal and in rat tail tendon tissues have confirmed that ISHG microscopy allows imaging of the relative orientation between noncentrosymmetric domains [35].
2.2 Sample preparation
The tissue sample was harvested from a rat medial gastrocnemius muscle and was fixed by 4% formaldehyde immediately post-dissection. The tissue was flash frozen in an OCT (Optimal Cutting Temperature Compound, Sakura Finetek, Dublin, OH) medium with no labelling or dehydration. The sample was sectioned using a cryostat (Leica CM-3505-S) into 20 μm slices. The use of thin slices of tissue samples minimizes the effect of light scattering. Furthermore, it ensures to maintain the laser and reference SHG beams’ phase relation while they propagate through the sample to recover an accurate phase (φexp). The slices were placed between two cover slips and glued with nail polish.
3. Results and discussion
First, the sample was imaged by conventional SHG microscopy. Standard SHG microscopy can easily be performed with the same setup after removing or rotating by 90° the reference quartz plate. Myosin filaments have non-zero χ zxx, χ xzx and χ zzz in their χ (2) tensor because of their C∞ symmetry [13,14]. While rotating the polarization of the pump laser to maximize SHG in the muscle tissue, we observed the same dependence on the SHG intensity as the one reported by Chu (Fig. 4(a) [13]), Plotnikov (Fig. 6(b) [6]) and Tiaho (Fig. 2(b) [14]). The dependence of the SHG intensity on the pump laser polarization is explained by the weakness of χ zzz in muscle compared to χ zxx and χ xzx. Note that ISHG microscopy is sensitive to these tensor elements since they are achiral in nature [13,36]. The polarization of the laser and the analyzer were oriented to maximize the yield of SHG signal at the photomultiplier tube. In the SHG image presented in Fig. 2(a) , the separation between each sarcomere can be seen and their length is approximately 2 μm.
Fig. 4.
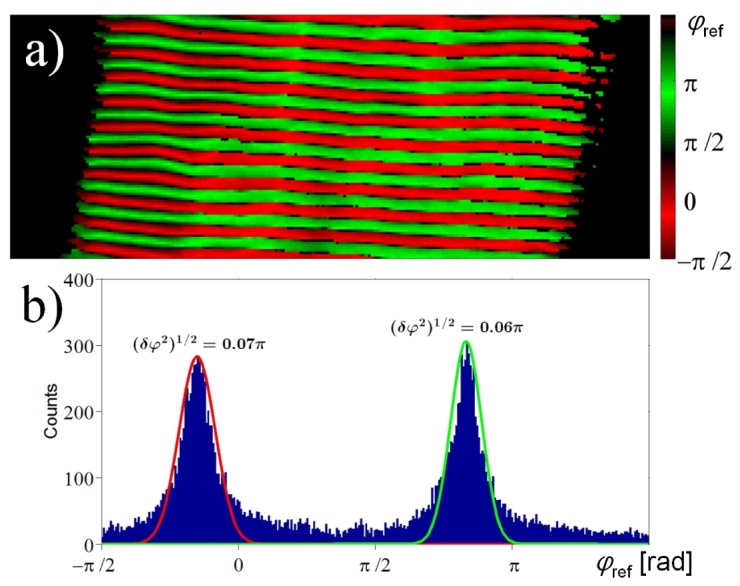
(a) Image of the SHG phase φexp interpolated from ISHG measurements (65 X 20 μm). (b) Histogram of the distribution of pixels from image (a) in function of their SHG phase φexp with Gaussian curve fits on the peaks.
Fig. 2.
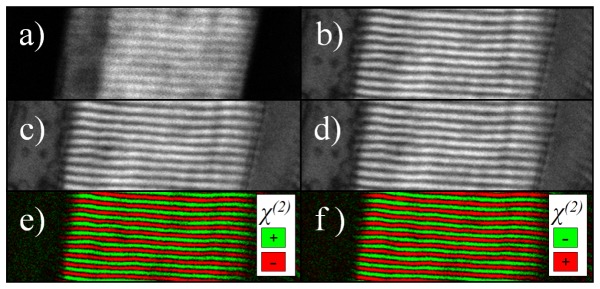
(a) Forward SHG image of muscle sarcomeres (65 X 20 μm). (b-d) Forward raw ISHG images of the same area taken at φref = (b) 105°, (c) 285° and (d) 465°. (e-f) Treated ISHG images obtained by subtracting image (b) to image (c) to obtain image (e) and by subtracting image (c) to image (d) to obtain image (f). As expected, image (e), to which we attribute φref = 105°, is the opposite of image (f), φref = 285°. The contrast is enhanced in calculated ISHG images.
To acquire ISHG microscopy images in the same area, the configuration of polarization and analyzer orientation used for SHG microscopy remained the same. The average power of the reference SHG was adjusted to be of the same order of magnitude as the average power of the sample SHG. The raw images obtained at the reference phases at which interferometric contrast was strongest (φref = 105°, 285° and 465°) are shown in Figs. 2(b)-2(d). As expected, the ISHG images at φref = 105° and 465° are almost identical. Even in the presence of a background SHG signal (Iref), visible on the left and right side of these images, the contrast is enhanced in sarcomere areas compared to standard SHG microscopy. Note on the far right side of the images the amplified ISHG signal. Other sarcomere structures absent from the SHG image are now highlighted. This is because the modulations in the interference depend of the square root of Iexp, which attenuates the difference between areas where Iexp is very strong and areas where it is very weak. ISHG microscopy has the potential to capture SHG image from structures with small χ(2). The treated ISHG image at φref = 105° is obtained by subtracting the raw ISHG image at φref = 285° from the raw ISHG image at φref = 105°. In the treated ISHG images obtained at φref = 105° and 285° shown in Figs. 2(e) and 2(f), the background signal has been suppressed, the contrast is high and the χ (2) domains are clearly delimited. At first glance, these images look very much like the one obtained at the surface of a periodically poled lithium niobate (PPLN) crystal [35]. The areas with opposite χ (2) appear in green and red for φref = 105°. The colors are switched, as it should be, for φref = 285° due to the π phase shift. However, it is necessary to analyze how the ISHG signal behaves at more than two reference phases to find the sample SHG relative phase φexp and to confirm the difference in the orientation of the myosin proteins at each end of the filaments.
The reference phase was varied by steps of 15° between each ISHG image acquisition. The average interferometric contrast in a domain was measured as a function of φref. For each reference phases, the average signal in the portion of a domain delimited in yellow in Fig. 3(a) corresponds to one data point in the curve shown in Fig. 3(b). This proves unambiguously that the interferometric contrast has a sinusoidal dependence on φref, as predicted by Eq. (2). As expected, the maximum interferometric contrast remains near φref = 105° and 285°. By tracing a profile parallel to the chains of sarcomere, as shown in blue in Fig. 3(a), a representation of the variation of the interferometric contrast with φref and the position along the profile was obtained. As shown in Fig. 3(c), the sample SHG phase is very well defined since the interferometric contrast is maximized everywhere in the profile at φref = 105° and 285°. Domains are formed by χ (2) structures along the profile. These domains emit perfectly π phase shifted SHG signals. They are spaced by a distance of 1 μm, half the distance found between the peaks of the SHG images. The image shown in Fig. 3(c) is in fact a surface made of similar sinusoidal curves, such as the one shown in Fig. 3(b), with a phase that changes by π at the interface between adjacent χ (2) domains along the profile drawn in blue in Fig. 3(a).
Fig. 3.
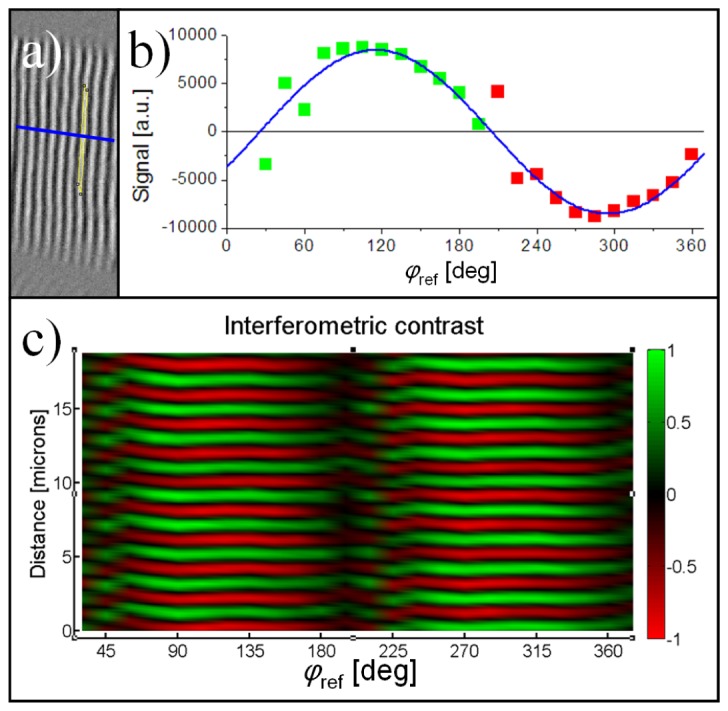
(a) Image of Fig. 2(e) rotated by 90° with a black and white contrast. An area in a domain is delimited in yellow and a profile crossing multiple domains is drawn in blue. (b) The average interferometric contrast in a single χ (2) domain, delimited in yellow in (a), in function of φref. As expected from Eq. (2), it has a sinusoidal shape. (c) The interferometric contrast along a profile crossing multiple sarcomeres, shown in blue in (a), in function of φref. The phase of the SHG generated by each χ (2) domain in the tissue is very well defined with a maximum at either φref = 105° or 285°. The image shown in (c) is in fact a surface made of sinusoidal curves, such as the one shown in (b), with a phase that flips by exactly 180° when encountering a new χ (2) domain while moving along the blue profile drawn in (a).
From the treated ISHG images obtained, it is possible to interpolate the SHG phase φexp and the interferometric contrast amplitude at each pixel in the image. Figure 4(a) shows an image of the SHG phase in the tissue. If the phase is around −0.15π, the pixel appears as red. If it is around 0.85π, it appears as green. If it is between these values or if the interferometric contrast amplitude is too low, the pixel appears as black. To facilitate the interpretation of this image, Fig. 4(b) presents a histogram of the distribution of the pixels as a function of their SHG phase φexp. Performing two Gaussian curve fits on the two peaks in this distribution provides their respective central positions which are found to be −0.15π and 0.83π. These two peaks are π phase shifted and they are of equal amplitude because there is an equal amount of green and red domains in the image. Note that the focal volume is large compared to an individual myosin protein and many of them simultaneously generate SHG. Since the SHG phase is well defined in the sample, this implies that the χ (2) tensor of consecutive myosin molecules in a domain are oriented in the same direction. This is in agreement with observations obtained from electron microscopy images [1–5].
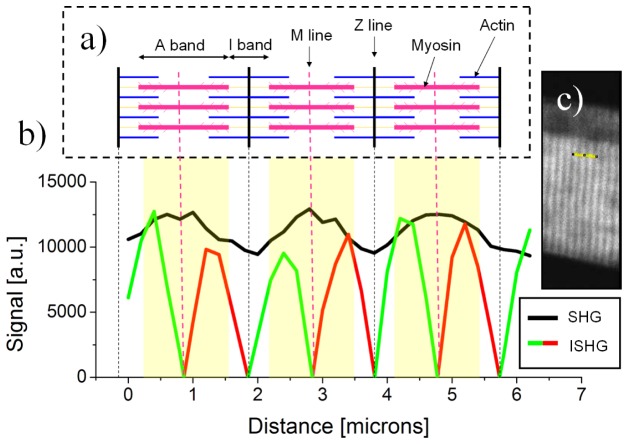
To fully understand the results discussed above, Fig. 5 shows a combination of the sarcomere model that was established from electron microscopy studies (Fig. 5(a)) alongside standard SHG and ISHG microscopy results (Fig. 5(b)). Figure 5(b) shows the SHG and ISHG signals along the profile covering three sarcomere units drawn in Fig. 5(c). In standard SHG microscopy, the A band containing the myosin filaments appears as a single peak centered on the M line in each sarcomere. However, in ISHG measurements, it appears as two π phase shifted peaks with the M line centered between them. This demonstrates that each end of the myosin filaments emit π phase shifted SHG signal which also means that the myosin proteins at each end of the filaments have an opposite orientation.
Fig. 5.
(a) A schematic representation of three consecutive sarcomeres. (b) SHG (black) and ISHG (green and red) signals along the profile drawn in (c). To better explain the results, the schematic representation (a) was scaled to match the curve presented in (b). ISHG microscopy can clearly distinguish the χ (2) inversion (separate red and green peaks) while SHG microscopy does not (single peak). These results also highlight the bipolar structural organization of the myosin filaments.
The absence of ISHG signal at the M line is due to the presence of myosin proteins with opposite polarity driven simultaneously in the focal volume which results in a low interferometric contrast. ISHG microscopy could be a useful technique to investigate the presence of a dip in the SHG signal of some sarcomere structures imaged with standard SHG microscopy [6–10]. These results highlight the bipolarity of myosin filaments in muscle tissue and show that muscle has a structural organization similar to a periodically poled crystal.
4. Conclusion
To conclude, ISHG microscopy reveals that each sarcomere contains two χ (2) domains generating π phase shifted SHG. This is because myosin filaments responsible for SHG are made of well aligned myosin proteins with opposite polarity at each end of the filaments. Compared to standard SHG microscopy, ISHG provides additional information about the relative orientation and structural organization of the noncentrosymmetric structures composing the tissues. This technique could help to explain why sarcomere can appear with a single or double band in standard SHG microscopy images. This work highlights, with ISHG microscopy, the bipolar structural organization of myosin filaments in sarcomere and shows that muscle are a periodically poled biological structure.
Acknowledgments
The authors acknowledge the financial support from the following funding agencies; NSERC, FRQNT, MDEIE, and CIPI. MR acknowledges the financial support of FRQNT for the Ph.D. award. The financial support of NIH grant DC005788 (Luc Mongeau, P.I.) is gratefully acknowledged.
References and links
- 1.Page S. G., Huxley H. E., “Filament Lengths in Striated Muscle,” J. Cell Biol. 19(2), 369–390 (1963). 10.1083/jcb.19.2.369 [DOI] [PMC free article] [PubMed] [Google Scholar]
- 2.Pollard T. D., “Structure and Polymerization of Acanthamoeba Myosin-II Filaments,” J. Cell Biol. 95(3), 816–825 (1982). 10.1083/jcb.95.3.816 [DOI] [PMC free article] [PubMed] [Google Scholar]
- 3.Xu J. Q., Harder B. A., Uman P., Craig R., “Myosin Filament Structure in Vertebrate Smooth Muscle,” J. Cell Biol. 134(1), 53–66 (1996). 10.1083/jcb.134.1.53 [DOI] [PMC free article] [PubMed] [Google Scholar]
- 4.Craig R., Woodhead J. L., “Structure and function of myosin filaments,” Curr. Opin. Struct. Biol. 16(2), 204–212 (2006). 10.1016/j.sbi.2006.03.006 [DOI] [PubMed] [Google Scholar]
- 5.A. G. Engel, Myology, 3rd edition (McGraw-Hill Professional, 2004), Chap. 7. [Google Scholar]
- 6.Plotnikov S. V., Millard A. C., Campagnola P. J., Mohler W. A., “Characterization of the Myosin-Based Source for Second-Harmonic Generation from Muscle Sarcomeres,” Biophys. J. 90(2), 693–703 (2006). 10.1529/biophysj.105.071555 [DOI] [PMC free article] [PubMed] [Google Scholar]
- 7.Prent N., Greenhalgh C., Cisek R., Major A., Aus Der Au J., Elmore S., Van Beek J. H. G. M., Stewart B., Squier J. A., Barzda V., “Second harmonic generation microscopy reveals contraction dynamics in muscle cells,” La Physique Au Canada 65, 129–131 (2009). [Google Scholar]
- 8.Greenhalgh C., Prent N., Green C., Cisek R., Major A., Stewart B., Barzda V., “Influence of semicrystalline order on the second-harmonic generation efficiency in the anisotropic bands of myocytes,” Appl. Opt. 46(10), 1852–1859 (2007). 10.1364/AO.46.001852 [DOI] [PubMed] [Google Scholar]
- 9.Recher G., Rouède D., Richard P., Simon A., Bellanger J.-J., Tiaho F., “Three distinct sarcomeric patterns of skeletal muscle revealed by SHG and TPEF microscopy,” Opt. Express 17(22), 19763–19777 (2009). 10.1364/OE.17.019763 [DOI] [PubMed] [Google Scholar]
- 10.Recher G., Rouède D., Schaub E., Tiaho F., “Skeletal muscle sarcomeric SHG patterns photo-conversion by femtosecond infrared laser,” Biomed. Opt. Express 2(2), 374–384 (2011). 10.1364/BOE.2.000374 [DOI] [PMC free article] [PubMed] [Google Scholar]
- 11.Schürmann S., von Wegner F., Fink R. H. A., Friedrich O., Vogel M., “Second Harmonic Generation Microscopy Probes Different States of Motor Protein Interaction in Myofibrils,” Biophys. J. 99(6), 1842–1851 (2010). 10.1016/j.bpj.2010.07.005 [DOI] [PMC free article] [PubMed] [Google Scholar]
- 12.Boulesteix T., Beaurepaire E., Sauviat M.-P., Schanne-Klein M.-C., “Second-harmonic microscopy of unstained living cardiac myocytes: measurements of sarcomere length with 20-nm accuracy,” Opt. Lett. 29(17), 2031–2033 (2004). 10.1364/OL.29.002031 [DOI] [PubMed] [Google Scholar]
- 13.Chu S. W., Chen S. Y., Chern G. W., Tsai T. H., Chen Y. C., Lin B. L., Sun C. K., “Studies of χ(2)/χ(3) Tensors in Submicron-Scaled Bio-Tissues by Polarization Harmonics Optical Microscopy,” Biophys. J. 86(6), 3914–3922 (2004). 10.1529/biophysj.103.034595 [DOI] [PMC free article] [PubMed] [Google Scholar]
- 14.Tiaho F., Recher G., Rouède D., “Estimation of helical angles of myosin and collagen by second harmonic generation imaging microscopy,” Opt. Express 15(19), 12286–12295 (2007). 10.1364/OE.15.012286 [DOI] [PubMed] [Google Scholar]
- 15.Légaré F., Pfeffer C. P., Olsen B. R., “The Role of Backscattering in SHG Tissue Imaging,” Biophys. J. 93(4), 1312–1320 (2007). 10.1529/biophysj.106.100586 [DOI] [PMC free article] [PubMed] [Google Scholar]
- 16.Odin C., Guilbert T., Alkilani A., Boryskina O. P., Fleury V., Le Grand Y., “Collagen and myosin characterization by orientation field second harmonic microscopy,” Opt. Express 16(20), 16151–16165 (2008). 10.1364/OE.16.016151 [DOI] [PubMed] [Google Scholar]
- 17.Freund I., Deutsch M., Sprecher A., “Connective tissue polarity. Optical second-harmonic microscopy, crossed-beam summation, and small-angle scattering in rat-tail tendon,” Biophys. J. 50(4), 693–712 (1986). 10.1016/S0006-3495(86)83510-X [DOI] [PMC free article] [PubMed] [Google Scholar]
- 18.Stoller P., Celliers P. M., Reiser K. M., Rubenchik A. M., “Quantitative second-harmonic generation microscopy in collagen,” Appl. Opt. 42(25), 5209–5219 (2003). 10.1364/AO.42.005209 [DOI] [PubMed] [Google Scholar]
- 19.Rivard M., Laliberté M., Bertrand-Grenier A., Harnagea C., Pfeffer C. P., Vallières M., St-Pierre Y., Pignolet A., El Khakani M. A., Légaré F., “The structural origin of second harmonic generation in fascia,” Biomed. Opt. Express 2(1), 26–36 (2011). 10.1364/BOE.2.000026 [DOI] [PMC free article] [PubMed] [Google Scholar]
- 20.Chen X., Nadiarynkh O., Plotnikov S., Campagnola P. J., “Second harmonic generation microscopy for quantitative analysis of collagen fibrillar structure,” Nat. Protoc. 7(4), 654–669 (2012). 10.1038/nprot.2012.009 [DOI] [PMC free article] [PubMed] [Google Scholar]
- 21.Gusachenko I., Tran V., Houssen Y. G., Allain J.-M., Schanne-Klein M.-C., “Polarization-Resolved Second-Harmonic Generation in Tendon upon Mechanical Stretching,” Biophys. J. 102(9), 2220–2229 (2012). 10.1016/j.bpj.2012.03.068 [DOI] [PMC free article] [PubMed] [Google Scholar]
- 22.Cicchi R., Vogler N., Kapsokalyvas D., Dietzek B., Popp J., Pavone F. S., “From molecular structure to tissue architecture: collagen organization probed by SHG microscopy,” J Biophotonics 6(2), 129–142 (2013). 10.1002/jbio.201200092 [DOI] [PubMed] [Google Scholar]
- 23.Mansfield J. C., Winlove C. P., Moger J., Matcher S. J., “Collagen fiber arrangement in normal and diseased cartilage studied by polarization sensitive nonlinear microscopy,” J. Biomed. Opt. 13(4), 044020 (2008). 10.1117/1.2950318 [DOI] [PubMed] [Google Scholar]
- 24.Brown C. P., Houle M.-A., Chen M., Price A. J., Légaré F., Gill H. S., “Damage initiation and progression in the cartilage surface probed by nonlinear optical microscopy,” J. Mech. Behav. Biomed. Mater. 5(1), 62–70 (2012). 10.1016/j.jmbbm.2011.08.004 [DOI] [PubMed] [Google Scholar]
- 25.Stoothoff W. H., Bacskai B. J., Hyman B. T., “Monitoring tau-tubulin interactions utilizing second harmonic generation in living neurons,” J. Biomed. Opt. 13(6), 064039 (2008). 10.1117/1.3050422 [DOI] [PMC free article] [PubMed] [Google Scholar]
- 26.R. W. Boyd, Nonlinear optics, 3rd edition (Academic Press, 2008), Chap. 1. [Google Scholar]
- 27.Kaneshiro J., Uesu Y., Fukui T., “Visibility of inverted domain structures using the second harmonic generation microscope: Comparison of interference and non-interference cases,” J. Opt. Soc. Am. B 27(5), 888–894 (2010). 10.1364/JOSAB.27.000888 [DOI] [Google Scholar]
- 28.Rechsteiner P., Hulliger J., Flörsheimer M., “Phase-Sensitive Second Harmonic Microscopy Reveals Bipolar Twinning of Markov-Type Molecular Crystals,” Chem. Mater. 12(11), 3296–3300 (2000). 10.1021/cm001018b [DOI] [Google Scholar]
- 29.Yazdanfar S., Laiho L. H., So P. T. C., “Interferometric second harmonic generation microscopy,” Opt. Express 12(12), 2739–2745 (2004). 10.1364/OPEX.12.002739 [DOI] [PubMed] [Google Scholar]
- 30.Masihzadeh O., Schlup P., Bartels R. A., “Label-free second harmonic generation holographic microscopy of biological specimens,” Opt. Express 18(10), 9840–9851 (2010). 10.1364/OE.18.009840 [DOI] [PubMed] [Google Scholar]
- 31.Shaffer E., Moratal C., Magistretti P., Marquet P., Depeursinge C., “Label-free second-harmonic phase imaging of biological specimen by digital holographic microscopy,” Opt. Lett. 35(24), 4102–4104 (2010). 10.1364/OL.35.004102 [DOI] [PubMed] [Google Scholar]
- 32.Winters D. G., Smith D. R., Schlup P., Bartels R. A., “Measurement of orientation and susceptibility ratios using a polarization-resolved second-harmonic generation holographic microscope,” Biomed. Opt. Express 3(9), 2004–2011 (2012). 10.1364/BOE.3.002004 [DOI] [PMC free article] [PubMed] [Google Scholar]
- 33.Stolle R., Marowsky G., Schwarzberg E., Berkovic G., “Phase measurements in nonlinear optics,” Appl. Phys. B 63, 491–498 (1996). [Google Scholar]
- 34.Jeon Y., Min H., Kim D., Oh-e M., “Determination of the Crystalline x-Axis of Quartz by Second-Harmonic Phase Measurement,” J. Korean Phys. Soc. 46, S159–S162 (2005). [Google Scholar]
- 35.M. Rivard, K. Popov, C.-A. Couture, M. Laliberté, A. Bertrand-Grenier, F. Martin, H. Pépin, C. P. Pfeffer, C. Brown, L. Ramunno, and F. Légaré, “Imaging the noncentrosymmetric structural organization of tendon with Interferometric Second Harmonic Generation microscopy,” J. Biophotonics, DOI: 10.1002/jbio.201300036 (2013). [DOI] [PubMed] [Google Scholar]
- 36.Rocha-Mendoza I., Yankelevich D. R., Wang M., Reiser K. M., Frank C. W., Knoesen A., “Sum Frequency Vibrational Spectroscopy: The Molecular Origins of the Optical Second-Order Nonlinearity of Collagen,” Biophys. J. 93(12), 4433–4444 (2007). 10.1529/biophysj.107.111047 [DOI] [PMC free article] [PubMed] [Google Scholar]


