
Fig. 3.
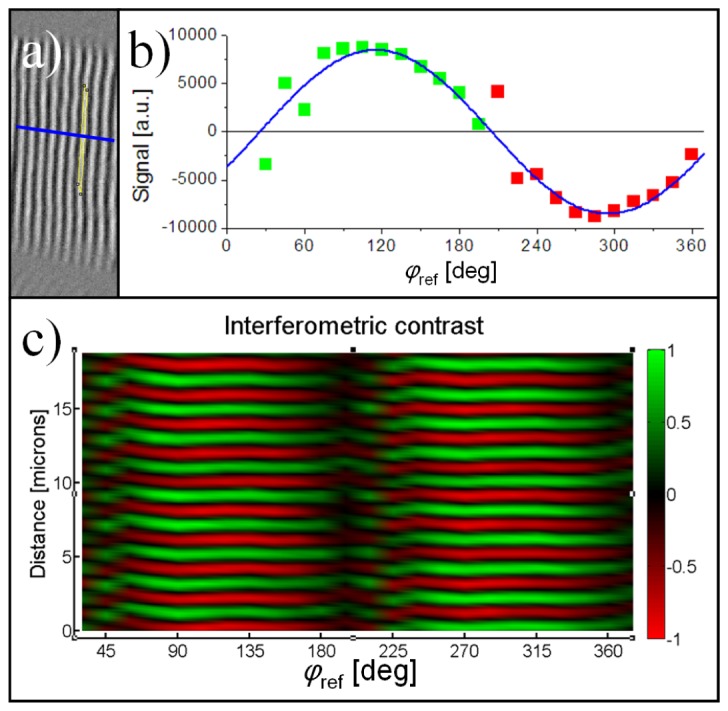
(a) Image of Fig. 2(e) rotated by 90° with a black and white contrast. An area in a domain is delimited in yellow and a profile crossing multiple domains is drawn in blue. (b) The average interferometric contrast in a single χ (2) domain, delimited in yellow in (a), in function of φref. As expected from Eq. (2), it has a sinusoidal shape. (c) The interferometric contrast along a profile crossing multiple sarcomeres, shown in blue in (a), in function of φref. The phase of the SHG generated by each χ (2) domain in the tissue is very well defined with a maximum at either φref = 105° or 285°. The image shown in (c) is in fact a surface made of sinusoidal curves, such as the one shown in (b), with a phase that flips by exactly 180° when encountering a new χ (2) domain while moving along the blue profile drawn in (a).