
Fig. 5.
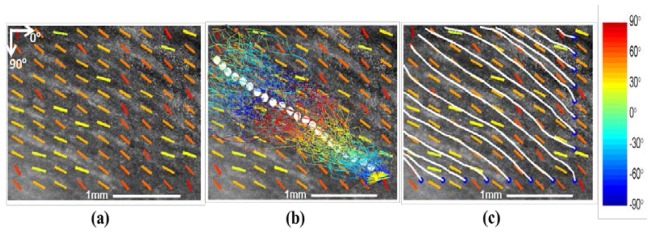
Fiber tracking in en face plane within a right ventricle (Heart IV). a) OCT image in en face plane, with orientation overlayed in coded color. b) Propagation of particles for tracking fiber trace. The fiber trace starts at an anchor denoted as blue dot. The colored lines show the traces how particles propagate from one step to another. The white dots are the estimated trace of fiber. c) Tractography results for multiple fibers. All fibers start at anchors located at the boundary of image. The white lines represent the fiber trace.