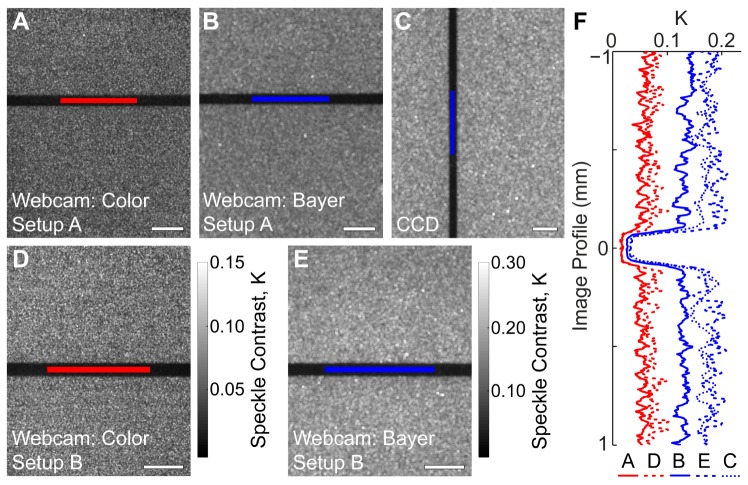
Fig. 2.
Representative speckle contrast images averaged over 10 frames illustrating the location of the ROIs used for analysis (shown in red for color mode and in blue for Bayer mode and CCD images). Speckle contrast images are shown for (A) the webcam acquired in color mode within the two-camera setup (mean K = 0.0536), (B) the webcam acquired in Bayer mode within the two-camera setup (mean K = 0.132), (C) the CCD camera acquired simultaneously with the webcam in Bayer mode (mean K = 0.167), (D) the webcam acquired in color mode in the inexpensive setup (mean K = 0.0676), and (E) the webcam acquired in Bayer mode in the inexpensive setup (mean K = 0.167). The color bar for (D) is the same as that for (A), and the color bar for (E) is the same as that for (B) and (C). Scale bars = 0.5 mm. (F) Cropped profiles are shown for images (A-E). Each profile is averaged over 20 pixels, and is plotted in physical space (mm) with the channel locations lined up for clarity.

