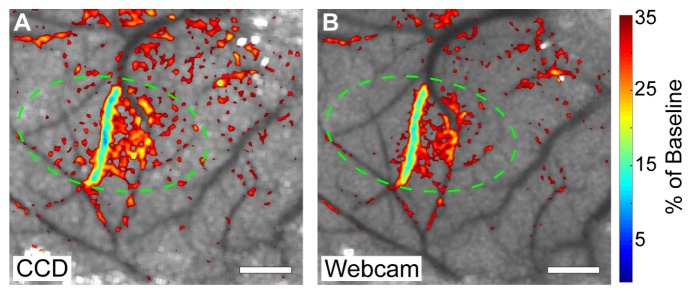
Fig. 5.

Relative blood flow overlay from the two-camera in vivo experiment depicting the reduction in flow after the stroke overlaid over baseline speckle contrast images with a 35% reduction of baseline cutoff for the CCD camera (A) and the webcam (B). Targeted area for photothrombosis is marked with a green circle in each image. Scale bars = 0.5 mm.
