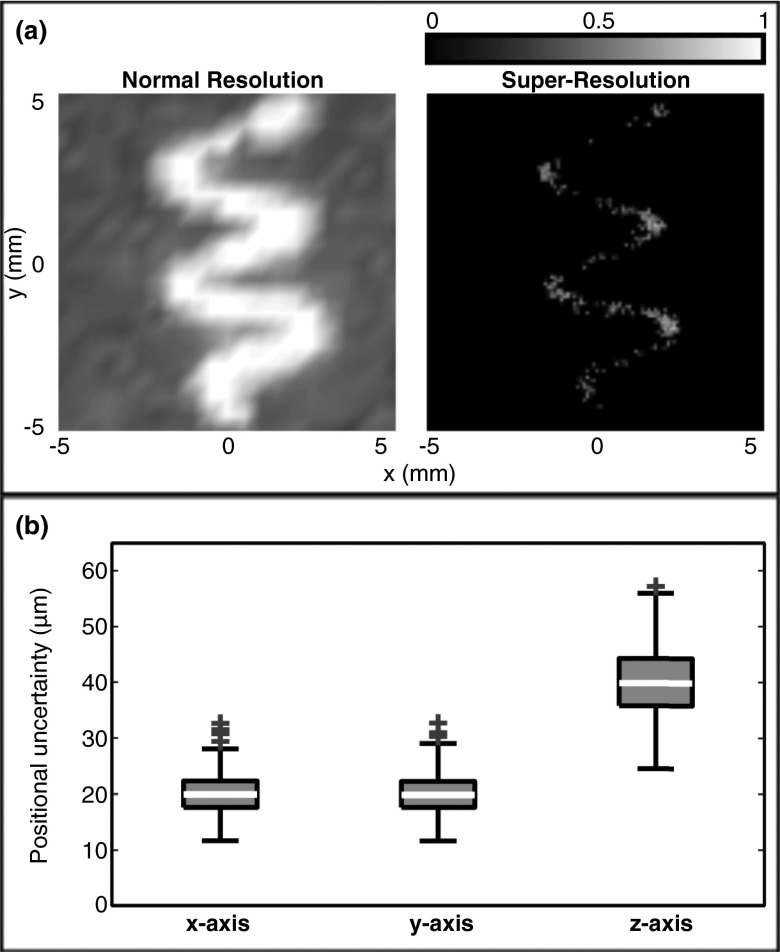
Figure 3.
(a) Normalized intensity maximum pixel z-projection images (2 cm stacks) at (left) normal resolution, and (right) after applying the super-resolution image processing. (b) Box and whisker plot showing the uncertainty on the positional estimates along the three axes. The outliers (crosses) are those points greater than 1.5 times the interquartile range beyond the third quartile.

