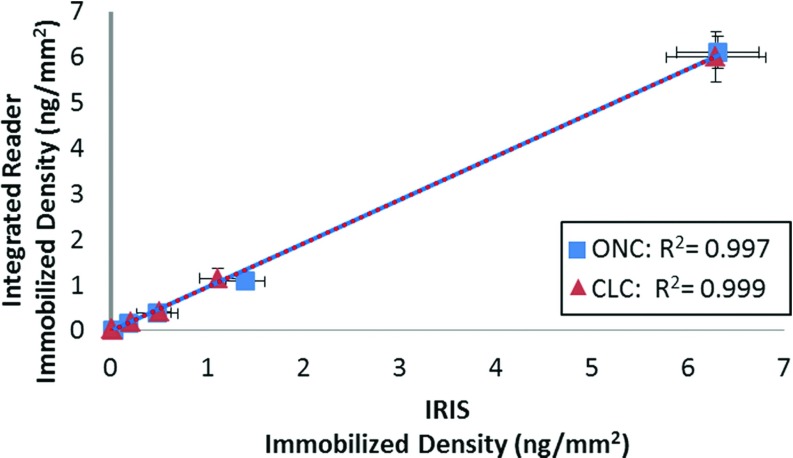
Figure 4.
Comparison of the IRIS platform and the calibrated fluorescence reader's label-free modality. Diminishing concentrations of probe were spotted onto 4 slides for ONC and 4 slides for CLC. The resultant average and standard deviation of the 10 replicate spots at each spotted concentration for both calibration methods are shown here for both instruments. An R-squared value of >0.995 in both cases exemplifies the validity of the ASR model for high NA IRIS measurements. Error bars are ±1 standard deviation.

