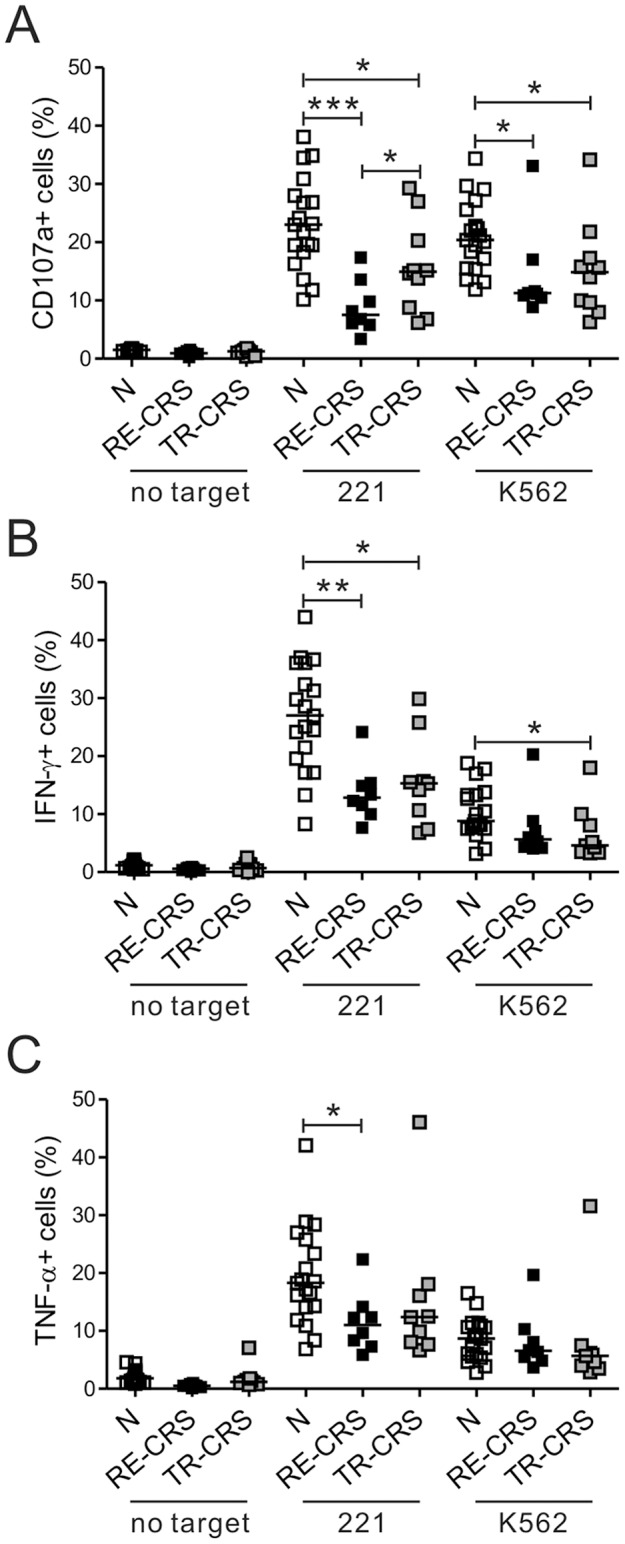
Figure 2. NK cell dysfunction associates with the clinical severity of CRS.

The patients with CRS were divided into the treatment-responsive (TR-CRS) and recalcitrant (RE-CRS) groups on the basis of the clinical severity and responsiveness to medication. The PBLs from the controls (N, n = 19), the RE-CRS group (n = 8), and the TR-CRS group (n = 10) were incubated with or without the indicated target cells, as described in Figure 1. The three groups were compared via summary graphs of the statistical dot plots in terms of the CD107a (A), IFN-γ (B) or TNF-α (C) expression by NK cells. Horizontal bars denote the medians. *P<0.05; **P<0.005; ***P<0.001.
