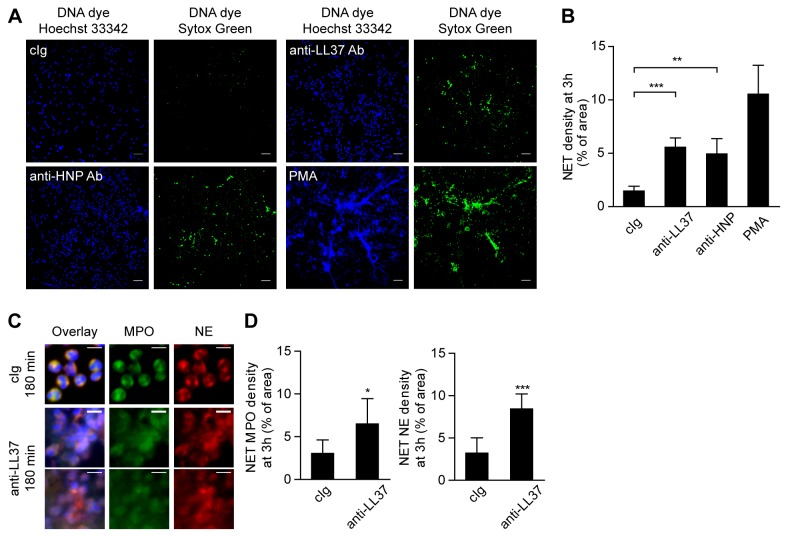
Figure 1. Localization of MPO and NE on extracellular DNA upon NET release in response to anti-neutrophil antibodies.
A) Fluorescence imaging of healthy neutrophils cultured with 10 µg/ml control IgG, 10 µg/ml anti-LL37 antibody, 10 µg/ml anti-HNP antibody or 25 ng/ml PMA as positive control and stained for total DNA with Hoechst 33342 (left panels) and extracellular DNA (Sytox Green, right panels) after 3 h of incubation. Scale bars, 50 µm. B) Quantification of NET release by healthy neutrophils using fluorescence microscopy. The density of extracellular DNA (stained with Sytox Green) over the image area after 3 h of incubation with control IgG (n=4), anti-LL37 antibody (n=4), anti-HNP antibody (n=3) or PMA (n=3) is shown as mean±SD. **p<0.01; ***p<0.001, ANOVA (adjusted for Dunnett’s test). C) Immunostaining for NET components (green, myeloperoxidase (MPO); red, neutrophil elastase (NE); blue, DNA). The experiment was repeated three times with neutrophils from independent donors, with similar results. Scale bars, 10 µm. Figures show details of larger fields of view, that were used to quantify NET NE and NET MPO density. Original magnification 20x. D) Quantification of NET release using fluorescently conjugated NET-specific antibodies (either anti-MPO or anti-NE antibodies). The MPO- and NE-stained areas are shown as mean±SD (n=3). *p=0.0498; ***p=0.0006, Student’s t test.

