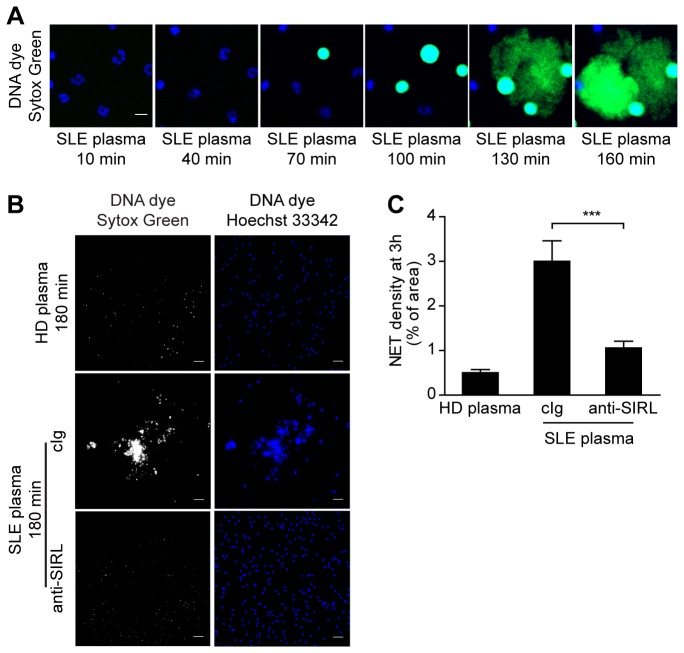
Figure 4. Engagement of SIRL-1 prevents NETosis in response to SLE plasma.
A) NET release from healthy neutrophils exposed to SLE plasma visualized as extracellular DNA (Sytox Green) by live cell imaging (Video S1) (neutrophils are blue; NETs are green). Individual frames are shown. Scale bar, 10 µm. B) Representative images of netting healthy neutrophils in response to SLE plasma with or without ligation of SIRL-1. Scale bars, 50 µm. C) Results from multiple independent donors are given. Neutrophils from 4 healthy donors were cultured for 3 h with 20% plasma from either nonautologous healthy controls (n=4) or individuals with SLE (n=5 or 6) in the presence or absence of anti-SIRL-1 mAb. NET formation was analyzed by fluorescence microscopy and the amount of NET-DNA quantified. Average density of each pooled group±SEM is shown. ***p<0.0001, paired Student’s t test.

