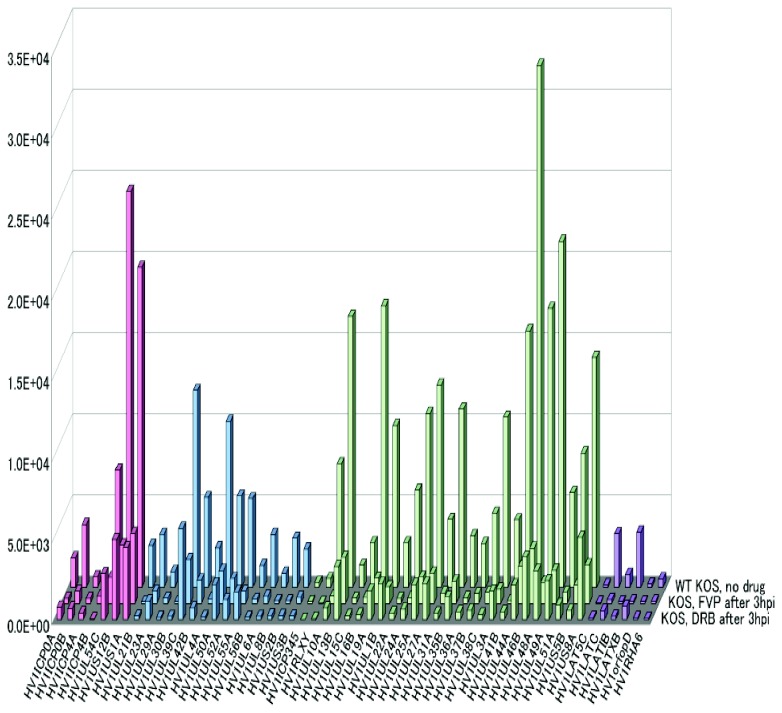
Figure 8. A global reduction in HSV-1 mRNA expression was seen in the presence of DRB and FVP.
HeLa cells were infected with HSV-1 KOS at an MOI of 10 and were either left untreated (no drug) or were treated with 100 µM DRB or 450 nM FVP starting at 3 h after infection. Total RNA was isolated at 8 h. Poly(A+) RNA was selected and reverse transcribed and the cDNA from each fraction was hybridized to HSV-1-specific microarray chips and quantified by using Array Vision software. The graph shown displays the averages of three independent experiments in which each transcript was represented three times on the array. The y axis represents the intensity of the light scattering signal and the x axis represents individual HSV-1 transcripts. Red bars represent immediate-early transcripts; early transcripts are in blue; late transcripts are in green, and LAT transcripts are in violet.

