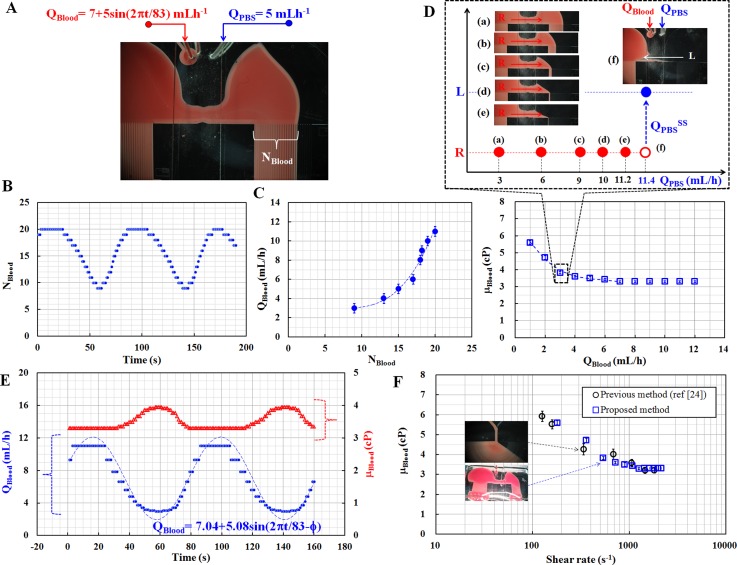
Figure 4.
Performance demonstration of the proposed method for given blood flow rates supplied by the syringe pump. (A) Flow rate of blood was controlled as sinusoidal function (QBlood = 7 + 5 sin (2πt/83) mL/h). The flow rate of PBS solution was carefully fixed at 5 mL/h. The number of indicating channels filled with blood in the right side channel was designated as NBlood. (B) Temporal variations of NBlood for a given flow rate of blood. (C) Relationship between blood flow rate (QBlood) and NBlood (D) Relationship between blood viscosity (μBlood) and blood flow rate (QBlood). (E) Temporal variations of viscosity (μBlood) and flow rate (QBlood) of blood were estimated by using the two relationships. (F) Quantitative comparison of viscosity values obtained using the proposed method and the previous method.24

