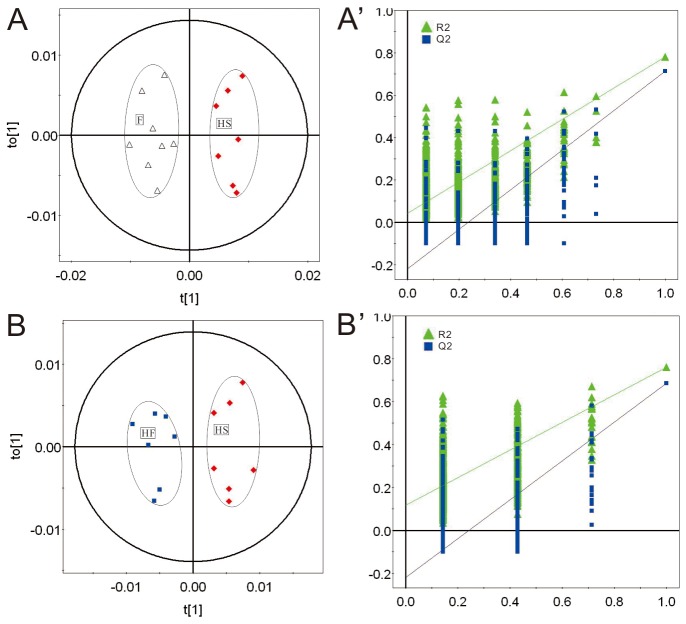
Figure 3. OPLS-DA scatter plots derived from 1H NMR spectra of aqueous extracts of mouse brain tissues and validation plots from the HS and the F groups (R2X(cum)=0.84 and Q2(cum)=0.86) (A, A'.
), and the HF and the HS groups (R2X(cum)=0.64 and Q2(cum)=0.81) (B, B').
The validation plots were obtained by using a permutation test that was randomly permuted for 500 times with the first component extracts. ▲ is for R2Y (cum), and ■ is for Q2 (cum). The vertical axis of the validation plots represented the R2 and Q2 values, and the horizontal axis (A', B') represented the correlation coefficients.

