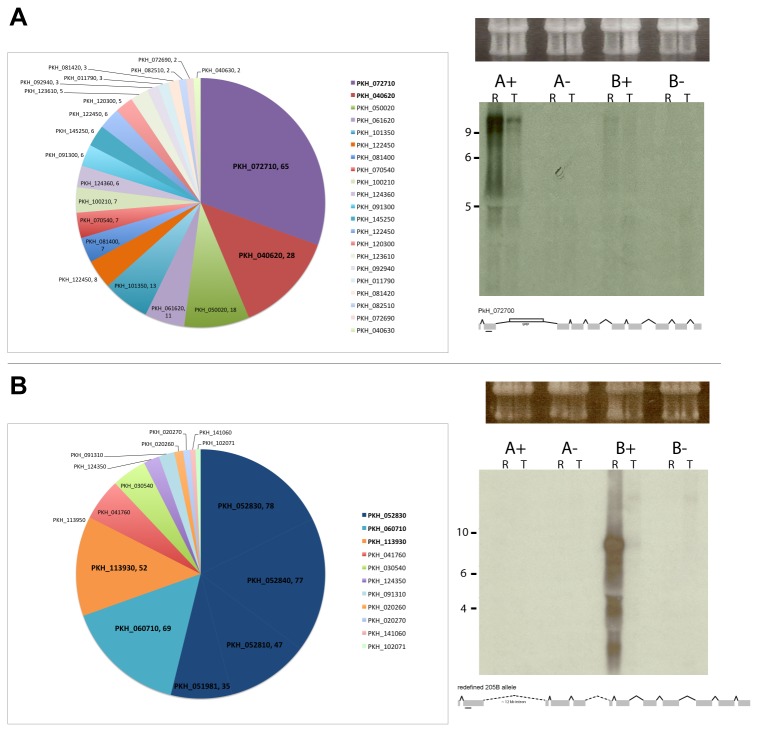
Figure 5. Relative abundance of peptide hits by spectral count and transcripts by northern blot of Pk1(A+) and Pk1(B+)1+ parasites.
(A) Pie charts depicting the SICA protein expression profiles shown in Figure 4, with relative abundance indicated by spectral counts. (B) Northern blots of ring and trophozoite stage RNA from the Pk1(A+) and Pk1(B+)1+ clones and their respective SICA[-] clones hybridized to gene-specific antisense riboprobes representing the most dominantly expressed SICA protein shown in the Table and Pie Chart. Schematics of known information on these SICAvar genes and the location of the riboprobes are shown by an underline. Total RNA ethidium bromide stain is shown above the respective blot.

