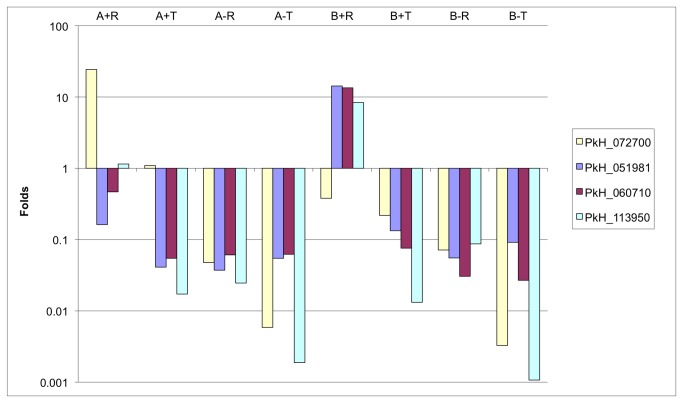
Figure 6. Quantitative Real Time-PCR profiles of specific SICAvar transcripts in Pk1(A+), Pk1(B+)1+ and the corresponding [SICA-.
] parasite from ring (R) and trophozoite (T) stages.
The relative transcript amounts corroborate the northern blot data shown in Figure 5. Amplicons represent gene-specific regions of the most predominant proteins detected by LC-MS/MS from Pk1(A+) (PkH_072700) and Pk1(B+)1+ parasites (PkH_051981, PkH_060710 and PkH_113950), respectively.

