
Figure 4. Dietary effects on Barnes maze training for wild type (WT) and transgenic (Tg) groups at 9 months.
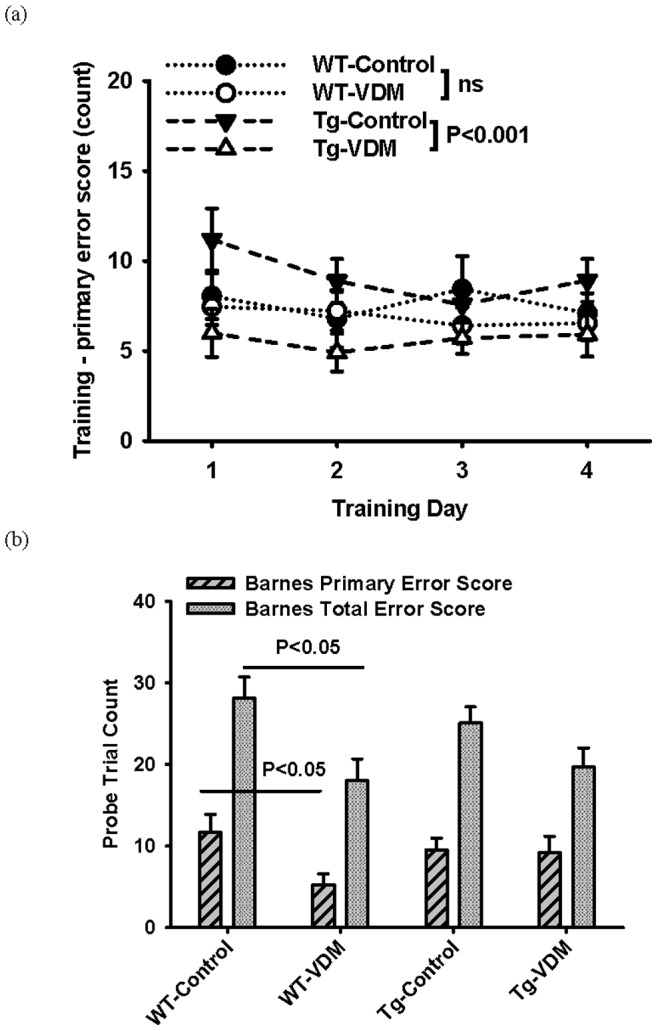
Results shown are (a) primary error score on 4 consecutive days, representing the average for the group and standard error at each time point. Tg-VDM were significantly more accurate than Tg-control group by 2-way repeat measure ANOVA (feed, day) F(1,23) = 13.092, P<0.001. (b) Subsequent probe trial testing on day 6 after removing escape hole showing primary and total error scores. Results represent the average for the group and standard error. For primary error score, the WT-VDM group was significantly more correct than the WT-control group by T-test (t = 2.186, P<0.05). For total error score, WT-VDM group was significantly more correct than WT-control group by T-test (t = 3.130, P<0.05).