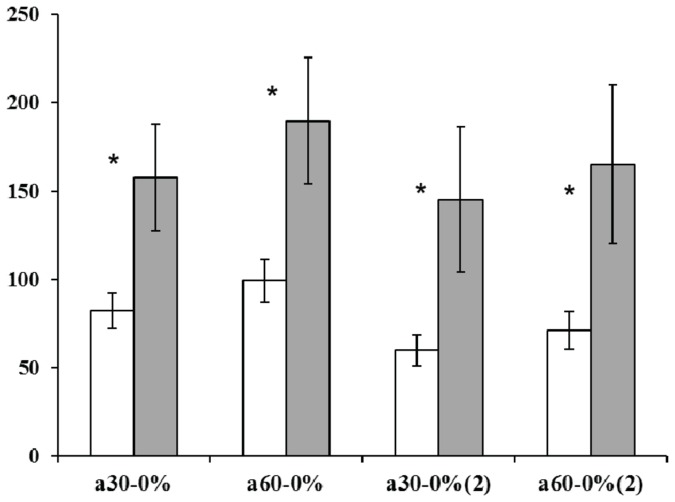
Figure 5. Md-PPO haplotype validation in the POP_2 progeny.
White bars represent individuals characterised by a heterozygous haplotype (“np”), while the grey bars show the homozygous category (“nn”). The standard error is reported in each bar.
On the x-axis, 30-0 and 60-0 are the percentage variation of ∆ a* calculated between T30-T0 and T60-T0 respectively (2). indicates the ∆ value calculated after two months’ cold storage.
As for the analysis carried out for the POP_1, five apples (biological replicates) were assessed for each genotypes, and for each fruit the flesh browning was measured of the two halves (technical replicates).
Asterisks show statistically significant comparison based on the LSD-ANOVA test (P-value ≤ 0.05).

