
Figure 5. Task performance correlated with delta phase by conditions.
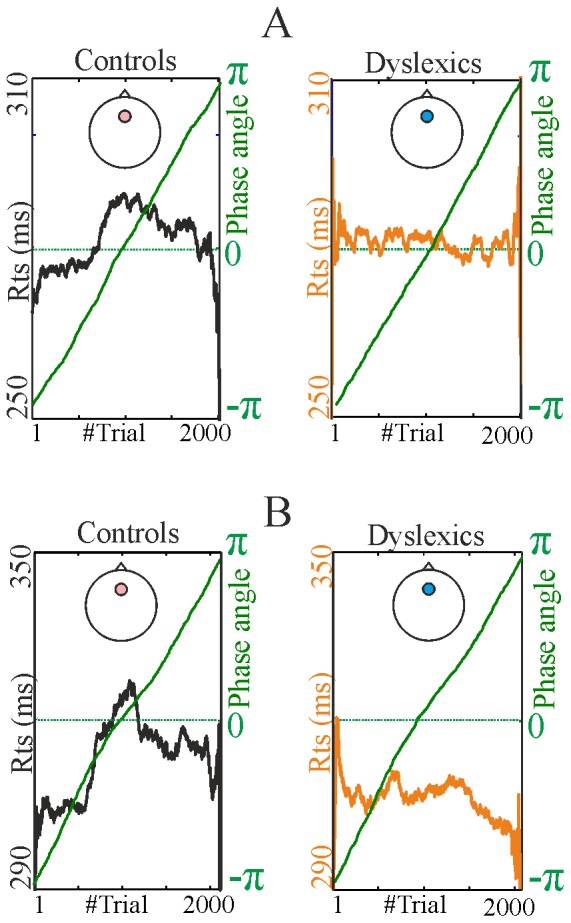
Panel A: 2 Hz condition. Panel B: 1.5 Hz condition. Both panels show RT-phase correlations from the most representative electrode (from the electrode approximately corresponding to FCz in the 10–20 electrode location system, see Figure 1). Trials are sorted according to their phase angle in ascending order. Trials with a prestimulus delta phase of –π are followed by trials with prestimulus delta phase ascending towards +π. The phase angle across the trials is represented by the green line. The corresponding RT value is represented by the blue line. The non-linearity of the blue line with respect to the green line for the control participants indicates that prestimulus delta phase predicts RT. For visualisation purposes the RT plots are smoothed using a 500 point sliding window.