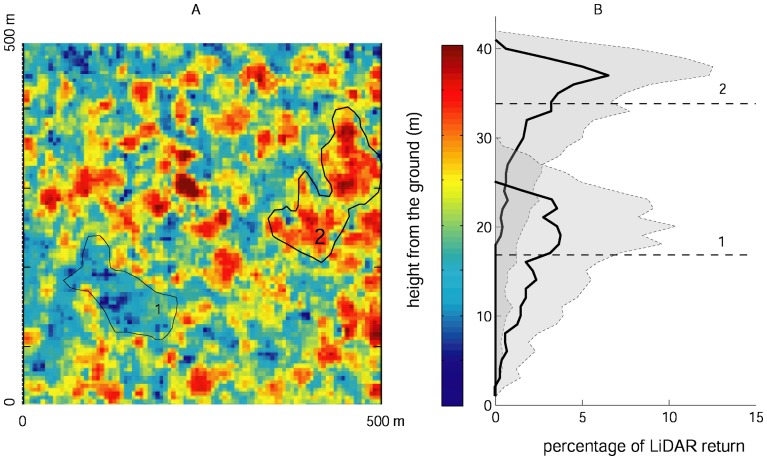
Figure 1. Lidar derived mean profile canopy height.
An example of the differences in vertical structure of areas differing in mean canopy height (MCH). A) LiDAR-derived mean canopy height (MCH) for a subset of the study area, polygons marked 1 and 2 delineate two patches of low and high canopy height, respectively. B) Vertical structure of areas 1 and 2 in panel A: horizontal dashed lines show the mean MCH, solid lines depict the median percentage of returns, and shaded areas show the 75th percentile.

