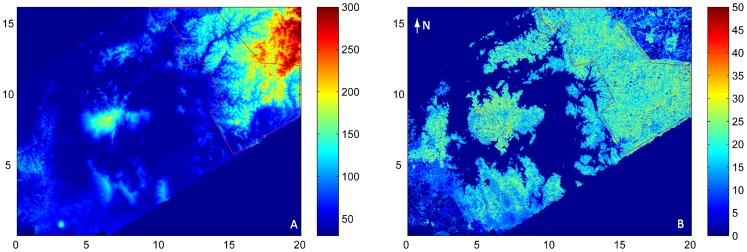
Figure 2. Study area.
A) LiDAR-derived DEM and B) LiDAR-derived mean canopy height (MCH) for the study area (red polygon) based on LIDAR data acquired in September 2009. Distances are in km, and heights in m. The large island to the left of the study area is Barro Colorado Island. Note the complex topography of the study area compared to the rest of the region covered by the LiDAR.

