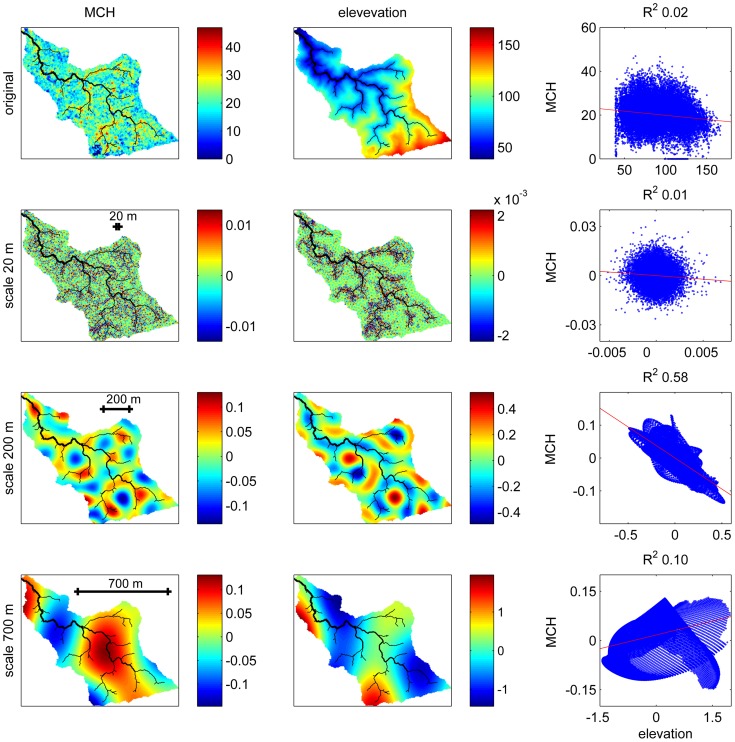
Figure 3. An illustration of how wavelet analysis enables multiscale analyses of bivariate relationships, for a 56 ha watershed extracted from the study area.
The top row shows the original, 5-m resolution data for LiDAR-derived mean canopy height (MCH) and elevation, along with a scatterplot showing their bivariate relationship, which is very weak. Wavelet analysis essentially decomposes the total spatial variation in MCH and DEM (top row) into the sum of deviations at different spatial scales, and bivariate wavelet analyses investigates how scale-specific deviations are correlated. Subsequent rows show the wavelet decomposition of MCH and DEM for three arbitrary scales: 20, 200, and 700 m. Scatterplots among these transformed variables (last column) reveal that areas that are locally lower in elevation at scales of ∼200 m tend to have higher biomass (3rd row), while at smaller or larger scales the correlation is weaker and may even be in the opposite direction. For reference, the drainage network (minimum drainage area 0.25 ha) is shown in black on the maps, and the ordinary linear regression lines in red on the scatterplots.

