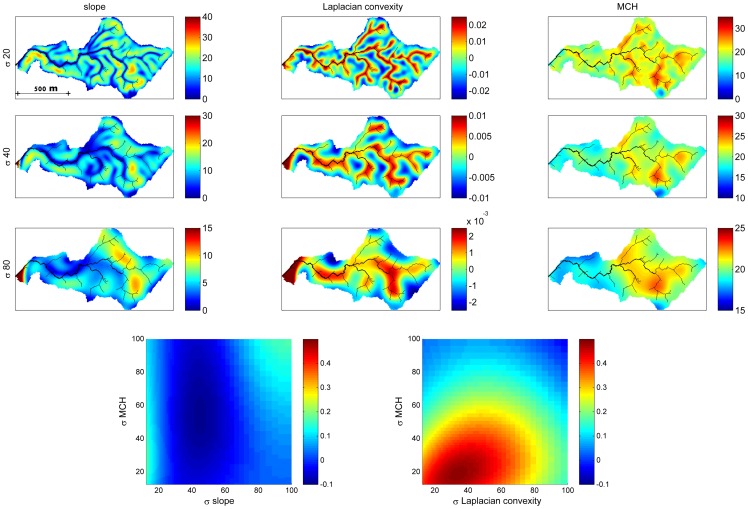
Figure 4. An illustration of the effect of smoothing at different scales on the spatial patterns of slope, Laplacian convexity and MCH (top), and on the correlation of MCH with slope and convexity, for a 58.6 ha watershed extracted from the study area.
Smoothing was done with a Gaussian smoothing filter of standard deviation 20, 40 and 80(minimum drainage area 0.25 ha) is shown in black on the maps for reference. The correlation coefficient between MCH and slope or convexity at different combinations of smoothing scales is shown in the bottom panels.

