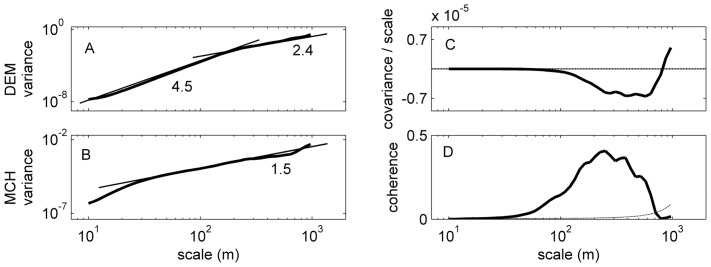
Figure 7. Wavelet spectra of elevation (A) and LIDAR-derived mean canopy height (B) in the entire study area (delineated in Figure 2).

Tangent lines and their slopes are shown for reference. (C) Normalized wavelet cospectrum between MCH and elevation (solid line); the area between the spectrum and the zero line (dashed line) is proportional to the total covariance. (D) Wavelet coherence between MCH and elevation (solid line) as a function of scale, compared with the 95% confidence interval for the null hypothesis of no correlation computed with 1000 IAAFT surrogates of the MCH map (dashed line).
