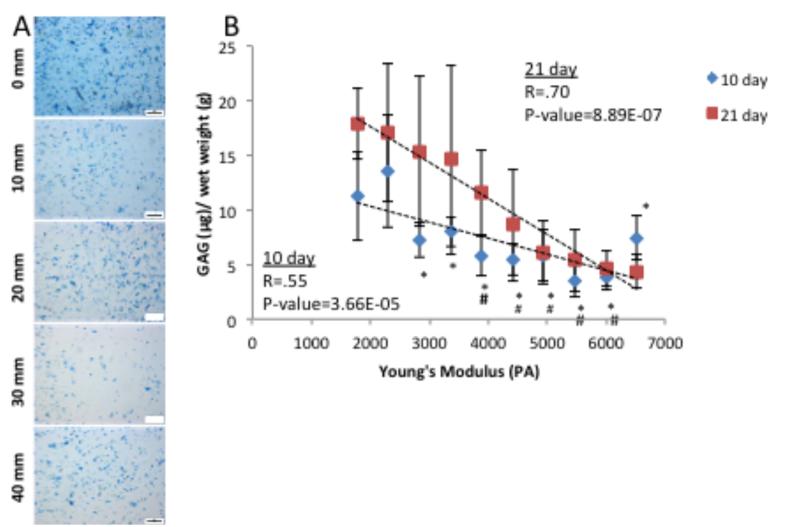
Figure 5.
Extracellular matrix production by human chondrocytes after 10 days of culture. Images were taken at 10 mm intervals along the length of the modulus gradient. A) Whole mount Alcian blue and B) Sulfated gylcosaminoglycan quantification based on Alcian blue extraction show distinct changes with position in the modulus profile at both 10 day and 21 days. Scale bar = 200 μm. # indicates a p-value ≤ 0.05 compared to 1700 Pa Young’s Modulus gradient position, and * indicates a p-value ≤ 0.05 compared to 2300 Pa Young’s Modulus gradient position

