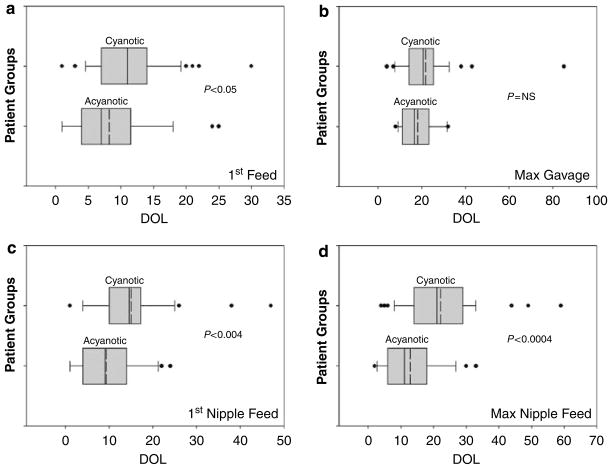
Figure 1.
Box plots showing age when 10, 25, 50, 75 and 90 percentiles were achieved in each group for the studied milestones. Mean value is depicted as dotted line within the box. Only those that have achieved the milestones are included, hence individual infant numbers (n) vary. (a) Shows age at first feed among acyanotic (n = 29), and cyanotic (n = 47). (b) Shows age at maximum gavage feeding among all acyanotic (n = 29) and 34 cyanotic infants. Among cyanotic group, nine infants did not need gavage feeding, whereas four died before reaching maximum gavage feeding. (c) Shows age at first nipple feed among acyanotic (n = 27, 2 did not nipple feed), and cyanotic (n = 41, six died before beginning nippling). (d) Shows age at maximum nipple feeds among acyanotic (n = 27), cyanotic (n = 37, as seven died and three needed tube feeds).

