
Figure 1. LPS induces primary microglial activation.
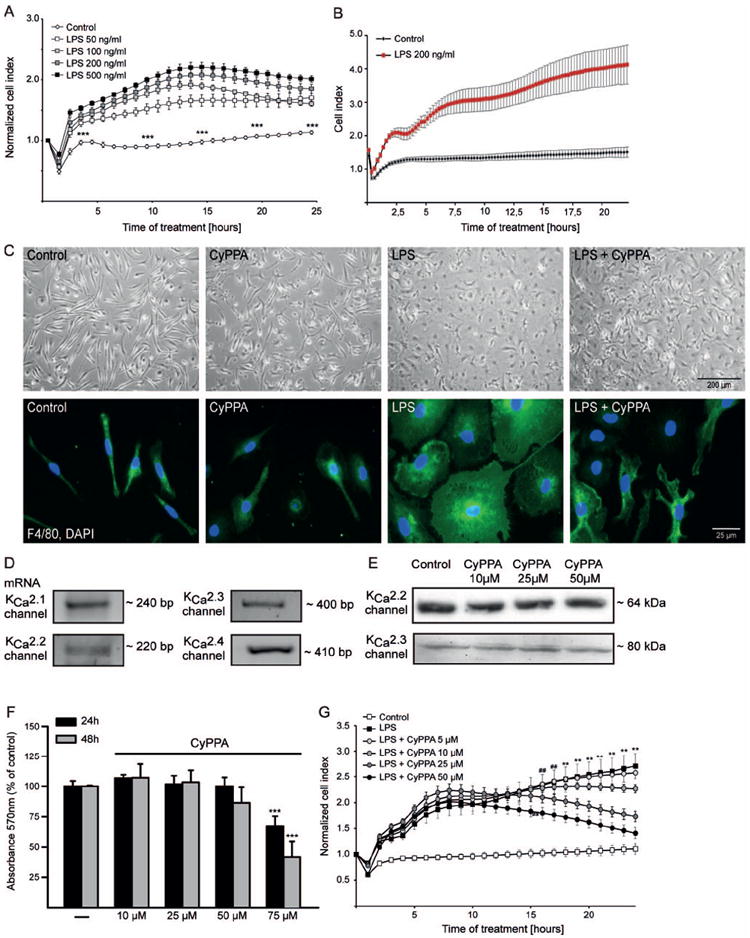
A. Microglial cells were seeded in 96 well E-plates at a density of 15000 cells/well and monitored with a real-time impedance-based xCELLigence system. After 24 h, cells were challenged with different concentrations of LPS, ranging from 50 to 500 ng/ml, as indicated. The time point of LPS treatment or media change is marked as “0 h” in the graph. B. Representative LPS kinetic curve using xCELLigence system (n=6 wells). The time point of LPS treatment or media change is marked as “0 h” in the graph. C. Morphometric alterations of activated microglia were visualized by bright-field microscope and by immunostaining with F4/80 antibody. D. mRNA analysis of KCNN/SK/KCa2 channel subtypes. E. Western blot analysis of KCNN2/SK2/KCa2.2 and KCNN3/SK3/KCa2.3 channels in microglial cells treated in the presence or absence of different concentrations of CyPPA, ranging from 10 to 50μM. F. MTT analysis of microglial cells treated with different concentrations of CyPPA for 24 and 48 h. Results are given as mean values ± S.D. (***p<0.001 versus non-treated microglia, ANOVA, Scheffé’s test, n=18 wells, repeated 3 times with independent primary microglia preparations). G. xCELLigence analysis of microglial cells treated with 200 ng/ml LPS, in the presence or absence of different concentrations of CyPPA (5–50 μM), as indicated. The time point of treatment is marked as “0 h” in the graph (**p<0.01 versus CyPPA-treated microglia (25μM), ##p<0.01 versus CyPPA-treated (50μM) microglia, ANOVA, Scheffé’s test, n=6 wells, experiment repeated at least 3 times with independent primary microglia preparations).