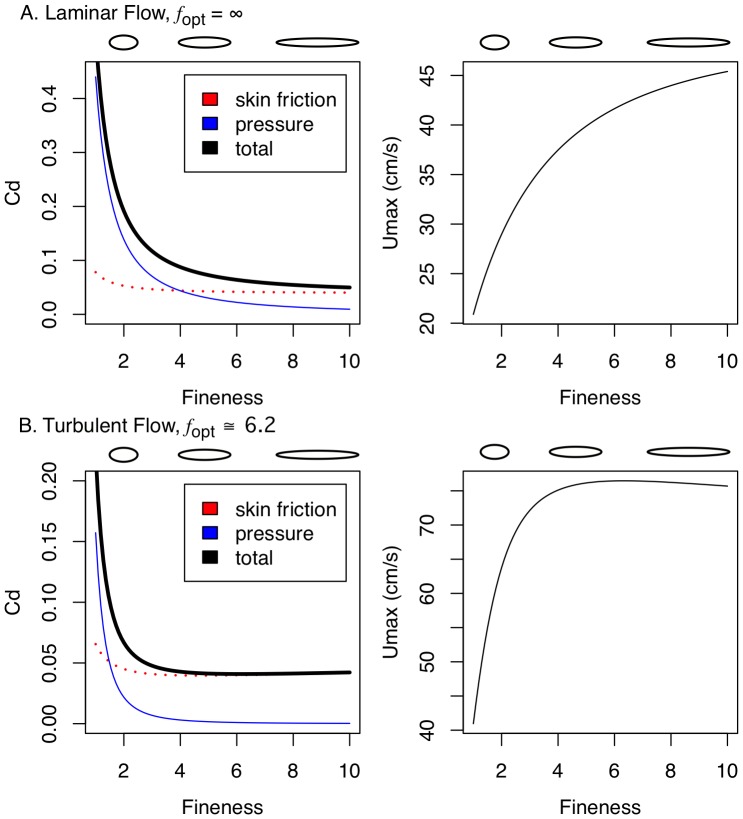
Figure 2. Performance as a function of fineness for rigid bodies of revolution.
C D(f) (left panel) and modeled maximum-prolonged swimming speed (right panel) for laminar (A) and lower-end of turbulent (transitional) (B) flow. Drag coefficients are standardized using (Vol)2/3 as the reference area and computed for bodies of equal volume and speed, but differing Reynold's number (Re). Total (black line), skin friction (dotted red line) and pressure (thin blue line) components are illustrated. The elliptical figures above the plot are representative midline sections for finenesses of 2, 5, and 10 to show the relative length and depth of bodies of differing fineness but equal volume. The scale of the ordinate differs between (A) and (B) to emphasize the shape of the curve within each plot.

