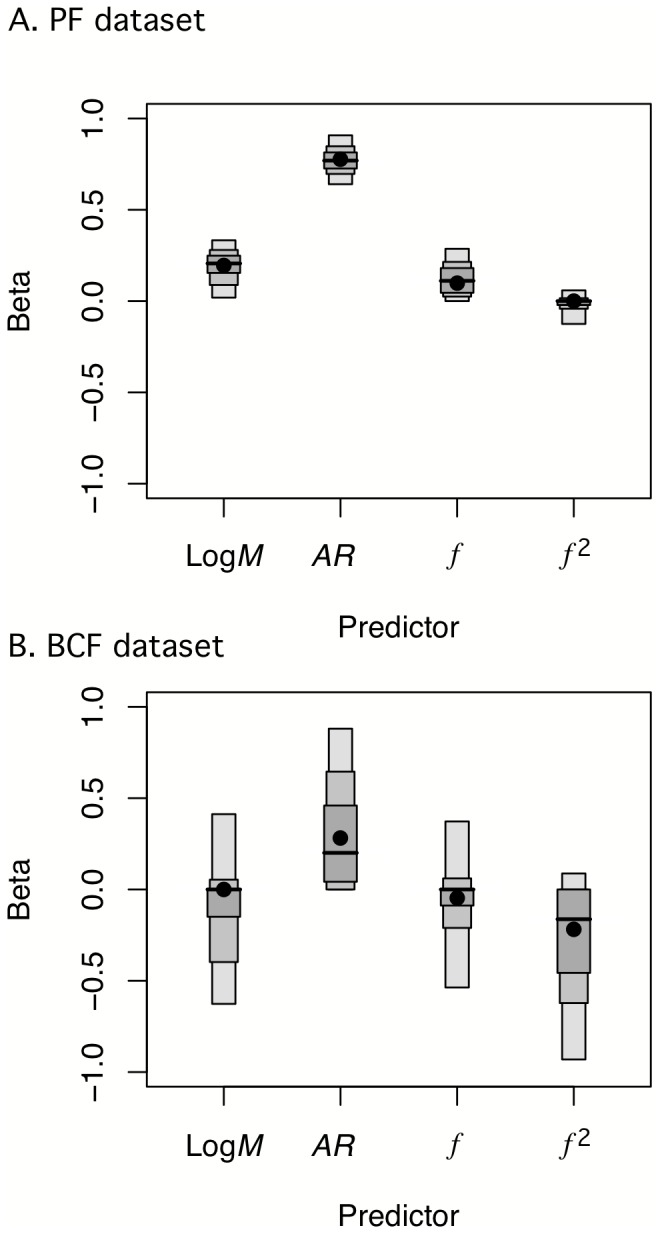
Figure 4. Box-percentile plots of the distribution of model-averaged β coefficients.

The distribution is from 5000 bootstrap samples of maximum prolonged-swimming speed (logU max) regressed on the predictor variables. For each bootstrapped pseudosample, the model-averaged β coefficients were computed from all retained (AICc≥min(AICc)+2) models in which the variable was included in the model. The outer, intermediate, and inner boxes represent the 95%, 75%, and 50% confidence intervals, respectively. The dashed line represents the median and the dot represents the observed value (Table 3). The scale of the ordinate is the same between (A) and (B) to emphasize the greater variance in the estimates in the BCF subset. Predictor variables are logM (body Mass), AR (propulsive fin aspect-ratio), f (body fineness ratio), and f 2.
