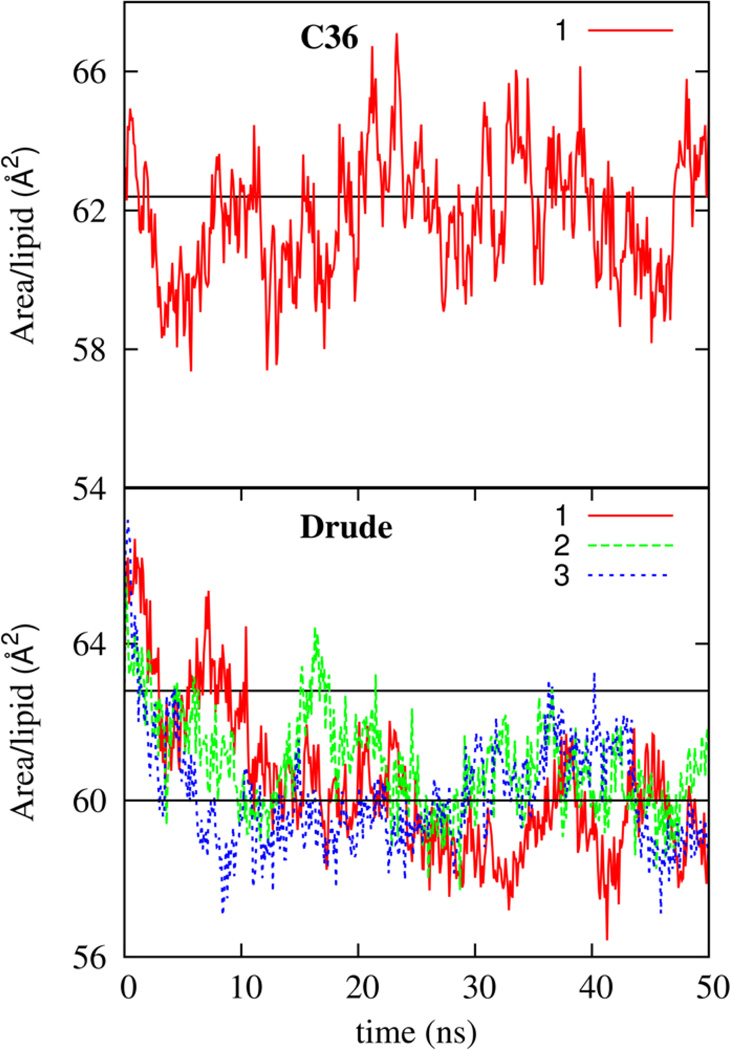
Figure 10.
The time variation of the NPT bilayer area per lipid for one simulation with the CHARMM C36 lipid FF and for three simulations with the final Drude model. Also shown with straight lines are the average magnitude of the area per lipid of 60 Å2 for the Drude FF and the experimental value of 62.8 Å2 which is reproduced by the C36 FF.

