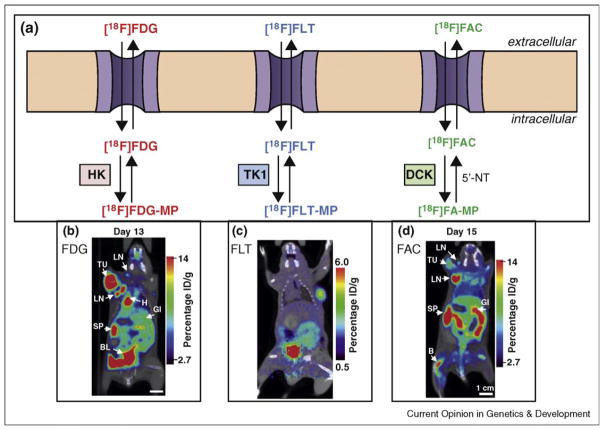
Figure 1.
(a) Schematic showing the metabolic pathways measured by FDG, FLT, and FAC. HK = hexokinase; TK1 = thymidine kinase-1; DCK = deoxycytidine kinase. (b) Preclinical FDG-PET scan of a mouse after injection with the MoMSV oncoretrovirus. At the period of peak immune response, high FDG uptake is seen in the tumor, lymph nodes, and spleen. Reproduced from Radu et al. [56••]. (c) FLT-PET scan of a LN229 xenograft implanted in a scid/ scid mouse. (d) Preclinical FAC-PET scan of a mouse after injection with the MoMSV oncoretrovirus. At day 15, the peak of the immune response, increased FAC uptake is seen in the lymph nodes (LN) and spleen (SP) compared to tumor (TU). Reproduced from Radu et al. [56••].

