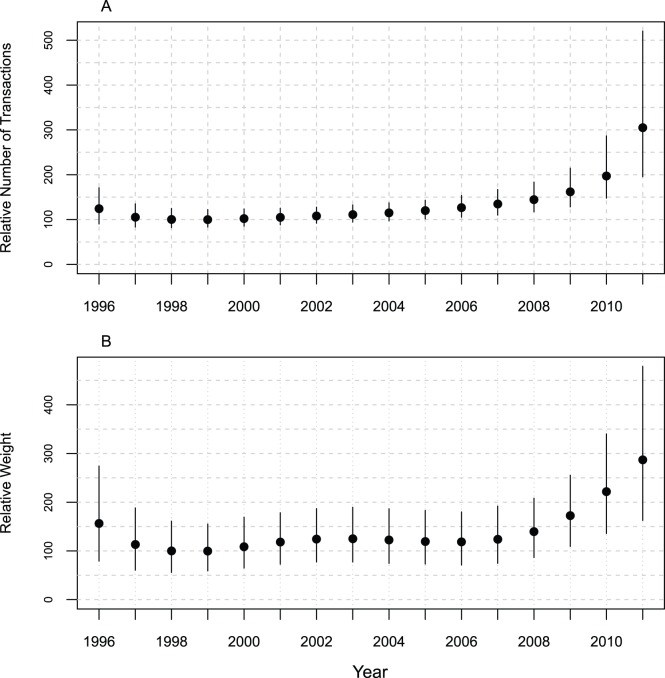
Figure 3. Transactions Index and Weights Index aggregated over ivory classes and countries with 90% credible intervals.
(A) Transactions Index (TI) and (B) Weights Index (WI). Dot represents the mean and the line the 90% credible interval for each year. The TI and WI are standardised by setting the 1998 value to 100 to constitute a baseline for comparisons with other years. This year was chosen because it was the first full year after ETIS (and MIKE) were mandated and African Elephant populations in three countries moved from CITES Appendix I to Appendix II enabling a tightly-controlled one-off sale of ivory from these countries to Japan to transpire in 1999.

