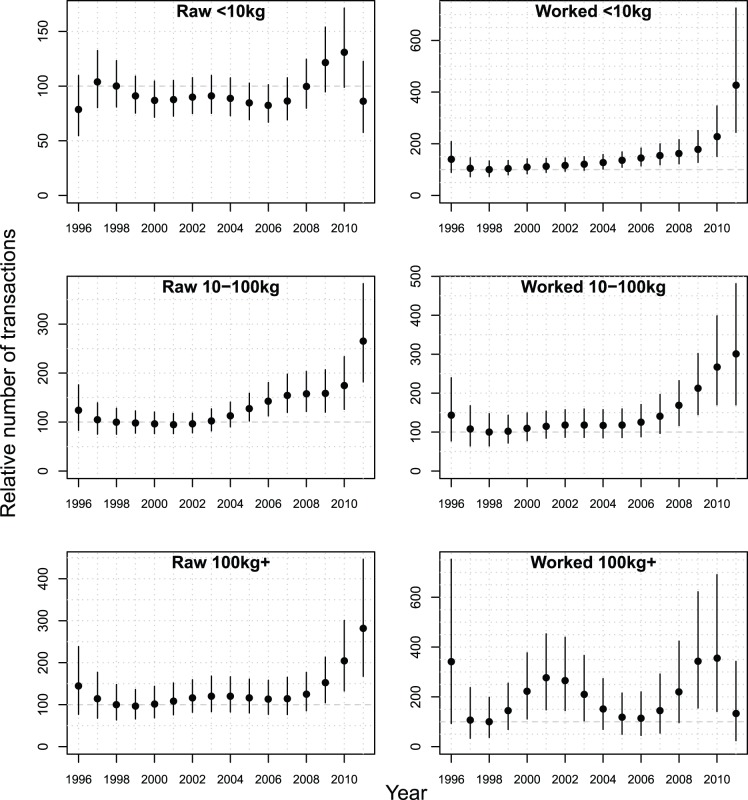
Figure 4. Transactions Index for each ivory class with 90% credible intervals.
Dot represents the mean, the line the 90% credible interval for each year. For each ivory class the TI is standardised by setting the 1998 value to 100 to constitute a baseline for comparisons with other years. Note the different y-axes due to the relative increase in each ivory class since 1998.

