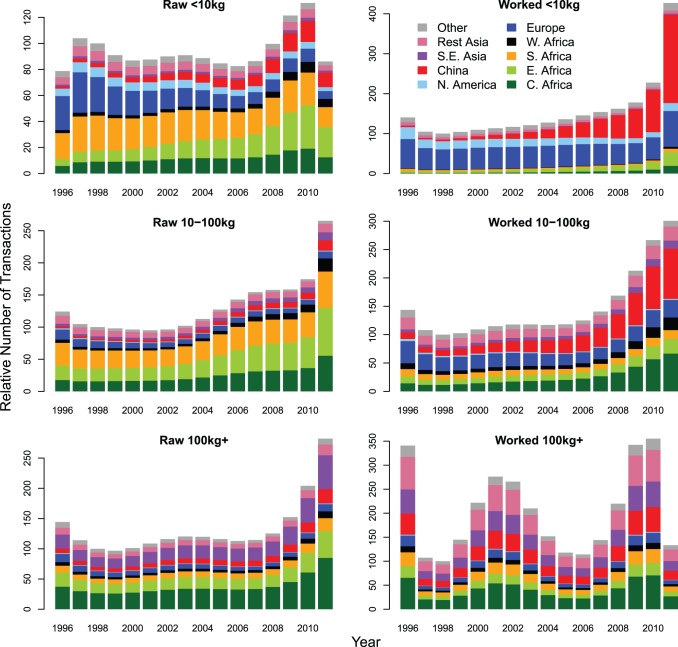
Figure 6. The mean Transactions Index for each region within each ivory class.
For each ivory class the Transactions Index (TI) is standardised by setting the 1998 total to 100 to constitute a baseline for comparisons with other years. Mean TI represents the relative number of seizures a country might be expected to make and report to ETIS if seizure and reporting rates were the same over time and across all countries. The countries within each region are listed in Table S2.

