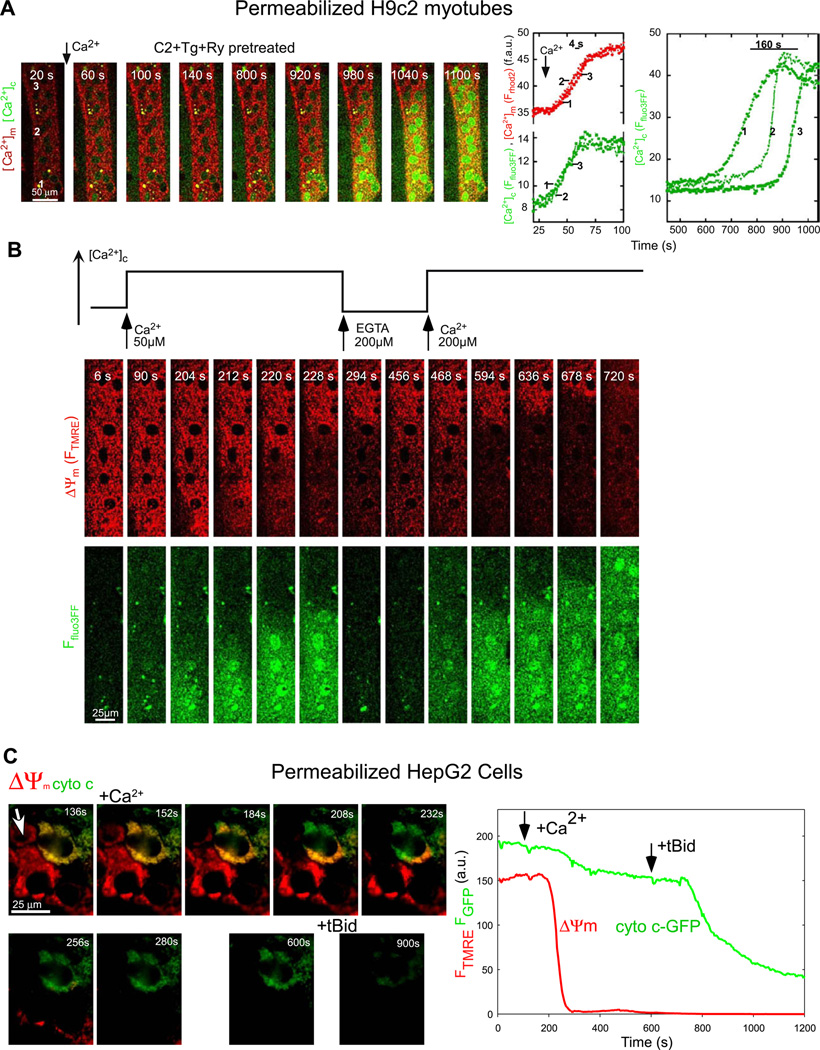
Fig. 3.
Real-time imaging of [Ca2+]c, [Ca2+]m, ΔΨm and cyto c-GFP distribution in permeabilized single cells: (A) Delayed [Ca2+]c dysregulation in a permeabilized H9c2 myotube pretreated with Tg (2 µM)+ Ry + C2. Simultaneous time-lapse confocal imaging of [Ca2+]c (green) and [Ca2+]m (red) was carried out using fluo3FF and compartmentalized rhod2 as described in methods section. Addition of Ca2+ (50 µM CaCl2) evoked a delayed and slowly propagating large amplitude [Ca2+]c wave. The right graph shows time courses (green) calculated for the marked subcellular regions. (B) Dependence of the mitochondrial depolarization and Ca2+ release waves on the [Ca2+]c rise and mitochondrial Ca2+ uptake. Simultaneous confocal imaging of [Ca2+]c and ΔΨm was carried out in permeabilized H9c2 myotubes. The fluorescence intensities of TMRE and fluo3FF reflecting ΔΨm and [Ca2+]c are depicted on linear red and green scales, respectively. The fluo3FF confocal images reflect [Ca2+]c changes in the selected focus plane. Therefore, rapid Ca2+ mobilization from intracellular stores is associated with fluo3FF responses even if a global [Ca2+]c rise does not occur. The plot above the confocal image time series shows the time course profile of global [Ca2+] changes in the cytosolic buffer. Waves were elicited in C2-treated permeabilized cells by addition of 50 µM CaCl2 and subsequently stopped by addition of a Ca2+ chelator (200 µM EGTA). When global [Ca2+]c was increased again, propagation of the waves continued the original spatial pattern. Changes in pH in the incubation medium associated with addition of EGTA and Ca2+ were <0.1 units. (C) Temporal and spatial organization of mitochondrial depolarization and cyto c-GFP release induced by C2+Ca2+. ΔΨm was monitored simultaneously with cyto c distribution in a cyto c-GFP-expressing and TMRE-loaded HepG2 cell. Sequential fluorescence images are shown as green (Fcytoc-GFP), red (FTMRE) overlays. Depolarization appears as a loss of the red fluorescence, whereas cyto c-GFP release appears as a loss of the green fluorescence. Cyto c-GFP was expressed only in the cell that is shown in the upper right quadrant. Permeabilized cells were pretreated with C2 (40 µM for 5 min) before addition of Ca2+ (50 µM CaCl2) and, subsequently, tBid (25 nM). The Ca2+-induced mitochondrial depolarization started in a discrete subcellular region and propagated as a wave through the cell (direction of the wave is marked by the white arrow in the upper left image). Time course of the fluorescence changes is plotted in the graph. Panels A,B are reproduced with modification from [26], and C is from [16] by permission.

