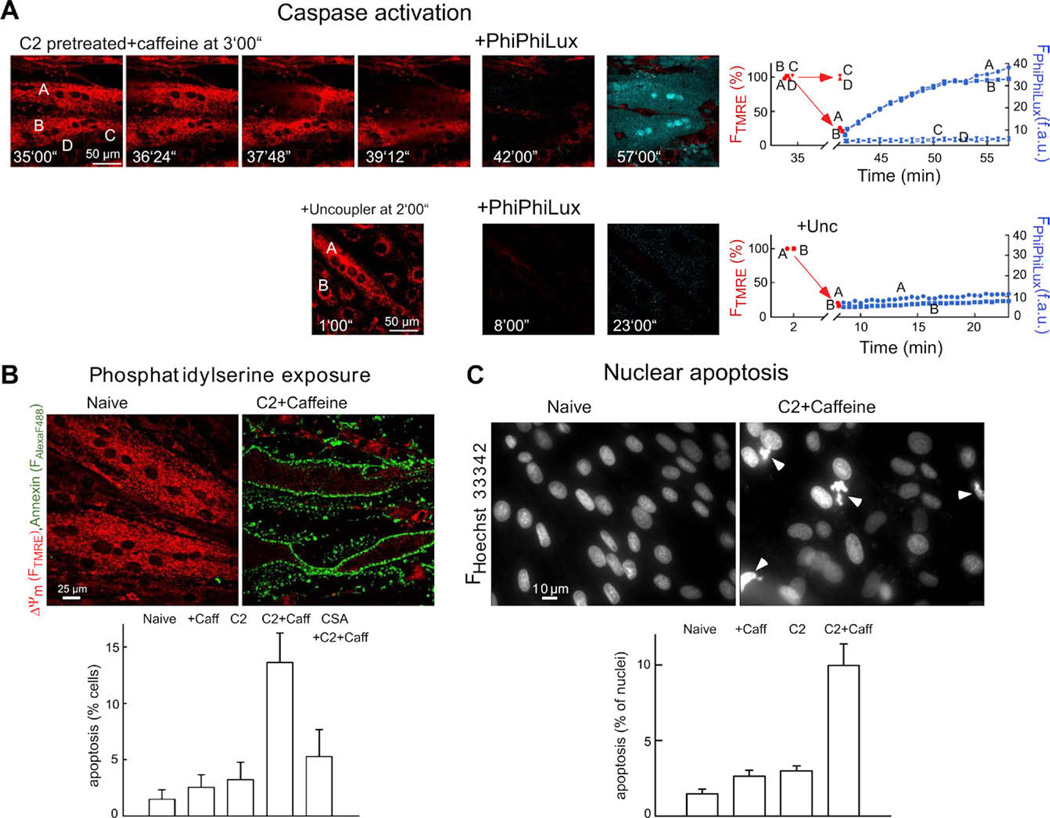
Fig. 5.
Fluorescence imaging of caspase activation and apoptosis in intact H9c2 myotubes: (A) Simultaneous confocal imaging of ΔΨm and fluorescent caspase cleavage products in single intact H9c2 myotubes. Cells were treated with C2 (40 µM for 5 h) followed by caffeine (15 mM) and Tg (2 µM) additions. After the Ca2+ signal-induced depolarization wave or the uncoupler (FCCP 5 µM + oligomycin 10 µg/ml)-induced depolarization was completed, the buffer was replaced with RPMI containing 5 µM cell-permeable fluorogenic caspase substrate (+ PhiPhiLux). Overlaid images of FTMRE (red) and FPhiPhiLux (blue) are shown. Time course for ΔΨm (red) and fluorescent caspase cleavage products (blue) is shown in the graphs. (B) PS exposure as visualized by annexin–Alexa Fluor 488 staining of intact myotubes. The adherent myotubes were pre-incubated with C2 (40 µM) or C2 + CsA (1 µM) or solvent for 2 h and, subsequently, 15 mM caffeine or solvent was also added for 4 h. Note that ΔΨm was measured simultaneously by annexin staining using TMRE. In myotubes with annexin–Alexa Fluor 488 staining, FTMRE was very low, indicating large mitochondrial depolarization. PS positive cells were plotted as % of total cell number in the graph (mean ± SE). (C) Nuclear apoptosis visualized by staining with Hoechst 33342/propidium iodide. Cells were treated as described in (B). Propidium iodide was excluded from >99% of naive, C2-treated and caffeine-stimulated cells and >98% of the C2 + caffeine treated myotubes, indicating the absence of late apoptotic or necrotic cells. Number of fragmented/condensed nuclei are shown in the graph (mean ± SE). Figure is reproduced from [26].

