
Fig. 3.
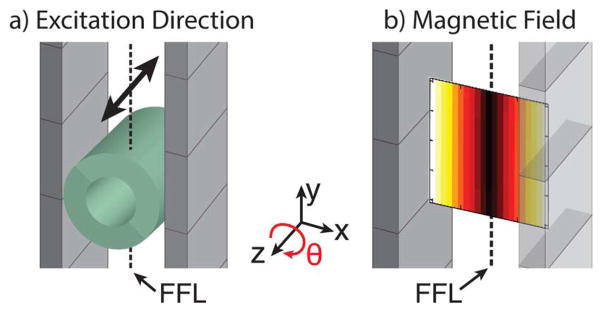
FFL excitation diagram and magnetic field plot. a) Diagram of the permanent magnets that generate the FFL and of the solenoidal transmit coil that excites USPIOs at 20 kHz. The arrow above the transmit coil indicates that the excitation direction is along the z axis. The ~2 Hz slow shift of the FFL occurs along the x axis. b) Magnetic field plot of the FFL with darker colors corresponding to smaller field strengths.