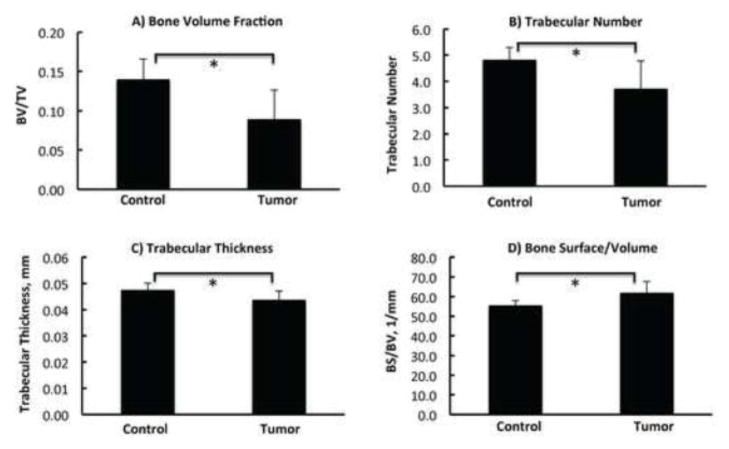
Figure 3.
Comparison of bone architecture from microCT analysis between the contralateral control and the tumor-bearing tibiae with osteolytic lesions (n=7). The bone volume fraction (BV/TV) (A), trabecular number (B), trabecular thickness (C) and bone surface/volume (D) were compared. Statistical significant difference was observed for Figure 3.A–D. Asterisk sign (*) represents p<0.05.

