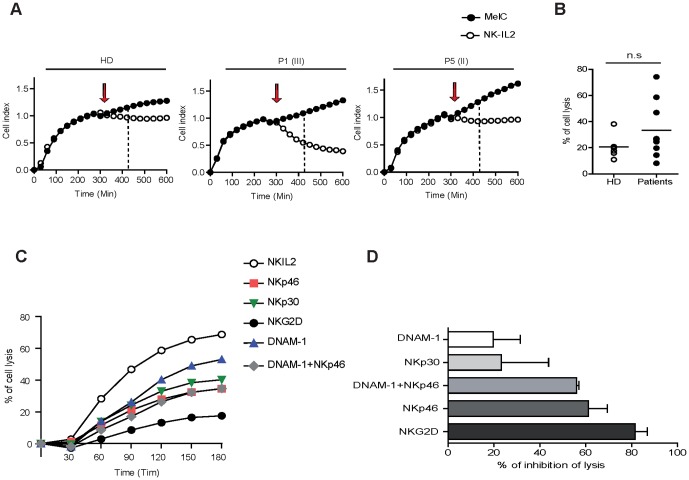
Figure 3. IL-2-activated NK cells from patients exhibited antitumor capacities.
(A) Dynamic measure of MelC cell index (CI) alone (black dots) and in presence of immunoselected IL-2-activated NK (white dots) from 1 donor and 2 patients are shown. Targets are monitored for cell adhesion for 5 h before and after addition of NK cells (arrow). NK cells (ratio 2/1) induce a rapid decrease of adherent target cell index (dotted line: 120 min after NK addition). In brackets, the clinical stage of each patient was noted. (B) Percentages of melanoma cell lysis by NK cells from 9 patients and 6 donors calculated from CI curves after 120 min of NK/target interactions. (C) Cytolysis experiments (n = 5) were performed in presence of anti-NKp46, anti-NKp30, anti-NKG2D or anti-DNAM-1 mAbs alone or in combination. Cytolysis curves (percentages of lysis) in presence of blocking mAbs are depicted for one representative experiment. (D) The percentages of lysis inhibition induced by the blocking of NK receptors are calculated at 120 min of co-culture (mean values and SD of 5 independent experiments).

