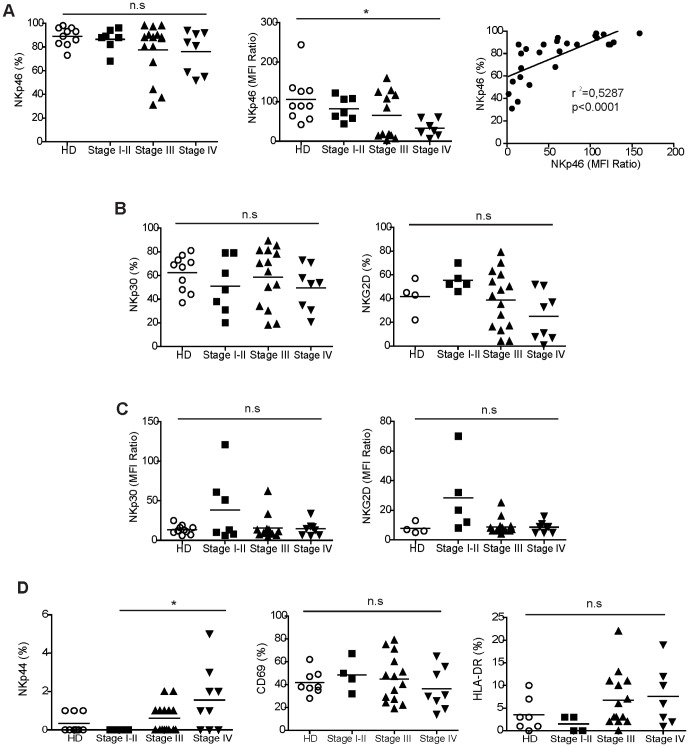
Figure 4. Phenotype of circulating NK cells from donors and patients along melanoma progression.
(A) Percentages (left) and levels of expression (MFI Ratio; middle) of NKp46 receptor by NK cells from donors and patients at different stages of disease; on the right, the correlation between NKp46 percentage and MFI ratio in patients. (B) Percentages of NK cells expressing NKp30 and NKG2D receptors in melanoma patients. (C) Levels of expression (MFI ratio) of NKp30 and NKG2D in melanoma patients. (D) Percentages of expression of NKp44 receptor and CD69 and HLA-DR activation molecules. Comparisons between the different groups were analyzed with the non-parametric K-W test (n.s = not significant; * p<0.05). Correlations were analyzed with Pearson test. Regression lines (r2) and p-values are reported.

