
Fig. 2.
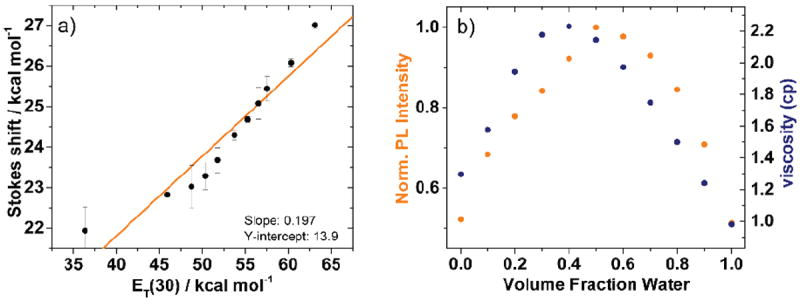
a) Stokes shift vs. sample ET(30) values with a linear fit (orange line, R2 = 0.899), and b) Fluorescence intensity at 440 nm (solid orange circles) and the change in sample viscosity (solid blue circles) as a function of the volume fraction of water in dioxane.