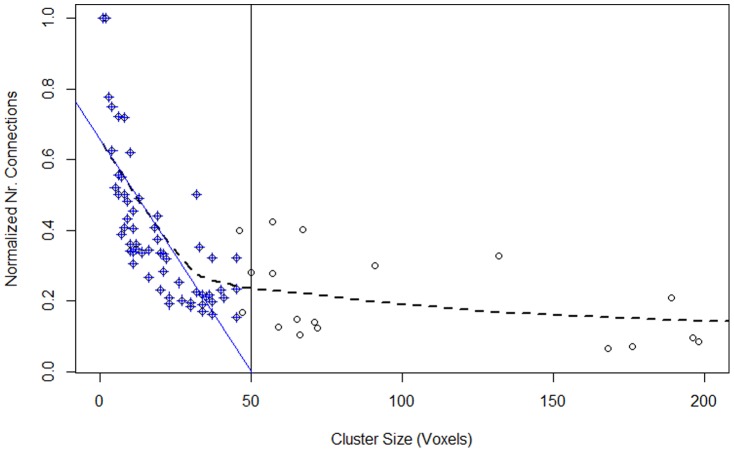
Figure 6. Intra-cluster connections of the clusters.
Scatter plot of the normalized intra-cluster connections (the ratio between the number of connections with CC≥0.3 and the number of possible connections) as a function of the cluster size. Locally weighted scatterplot smoothing (LOESS) regression analysis (dashed curve) shows a distinct change in trends in the data. To emphasize this change, linear regression (shown in blue) was used to extrapolate the initial distinct trend of the LOESS curve. Linear regression occupied 63 of the smallest clusters (shown in blue crosses) and intersects the x-axis at 50.02. This observation was used to determine the minimum cluster size threshold.

