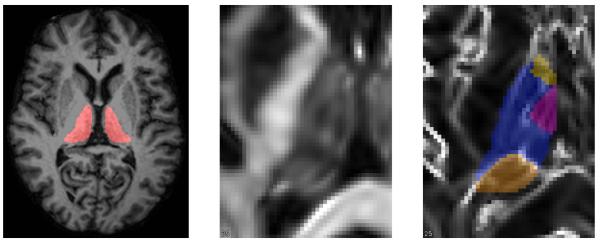
Fig. 1.

Left: axial brain slice with thalamus highlighted. Middle: closeup of left thalamus in fractional anisotropy (FA). Right: left thalamus nuclear delineation from the Knutsson edgemap image (Sec. 2.1): anterior nucleus [yellow], medialdorsal [red], ventral group [blue], and pulvinar [orange].
