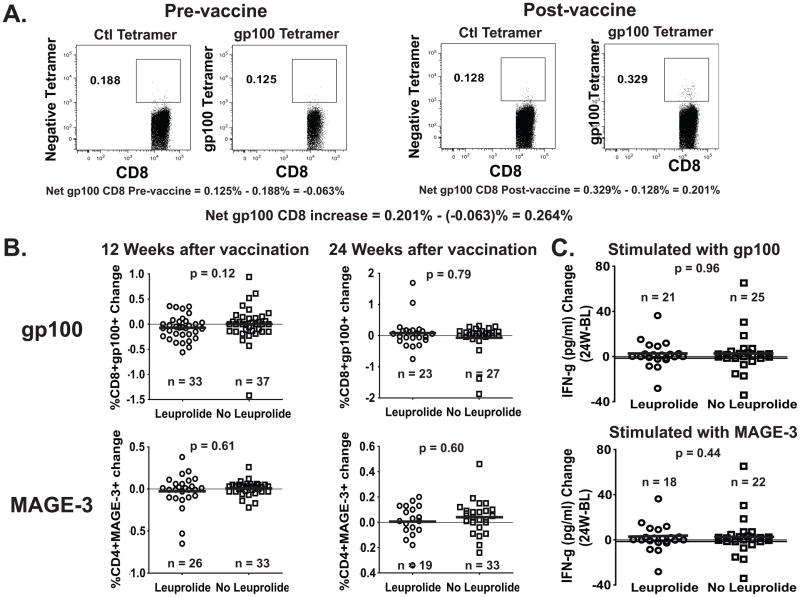
FIGURE 2. Change in Frequency of gp100209-2M –specific CD8+ and MAGE-3243-258 –specific CD4+ T cells between baseline and weeks 12 or 24 after treatment, measured by tetramer (CD8) and multimer (CD4) staining assay.
Frozen/thawed PBMC from patients at different time points were stained with class I HLA-A*0201-restricted gp100209-2M tetramer (A) and class II HLA-DP4-restricted MAGE-3243-258 multimer (not shown). How the net tetramer/multimer calculation is carried out is represented (A). Cells were stained with anti-CD11c/CD14/CD15/CD16/CD19 FITC (dump channel), MAGE3 Multimer PE, CD4 PerCP-Cy5.5, gp100 Tetramer-APC and CD8-APC/Cy7. The numbers in (B) represent the net change of gp100209-2M –specific CD8+ and MAGE-3243-258 –specific CD4+ T cell subsets within the CD8 and CD4 T cell population, respectively, at 12 and 24 weeks after vaccination. The numbers in (C) represent the net change of IFN-γ secretion after O/N stimulation of patients’ PBMC with peptides gp100209-2M or MAGE-3243-258 at 24 weeks after vaccination when compared to the Baseline (W24-BL).

