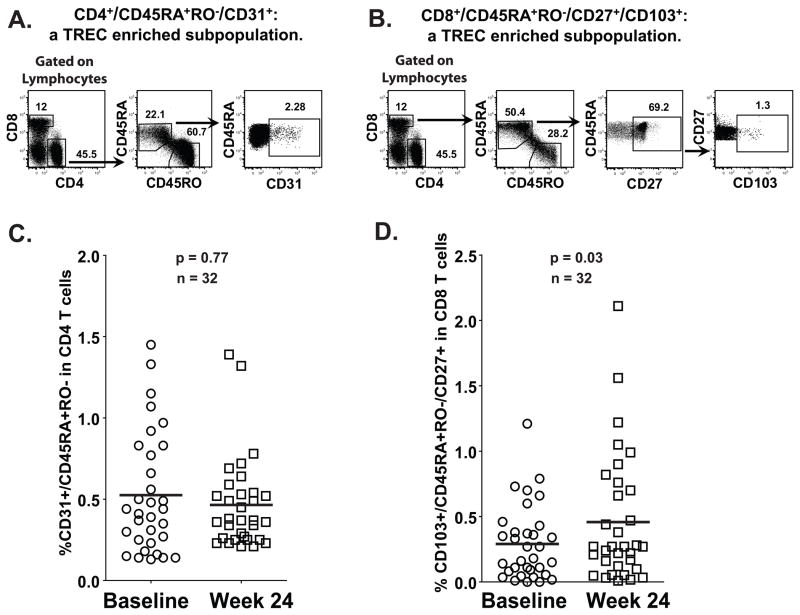
FIGURE 5. The TREC-enriched CD8+CD103+ naive CD8+ T cell subset, but not the TREC-enriched CD4+CD31+ naive CD4+ T cell subset, increased at week 24 after treatment in both Leuprolide treated and untreated patients.
Multiparameter flow cytometric analysis of CD4+CD45RA+RO−CD31+ and CD8+CD45RA+RO−CD27+CD103+ subsets was performed using Frozen/thawed PBMC from 32 patients at different time points. Cells were stained with anti-CD4-AmCyan, CD8-Pacific Blue, CD45RA-FITC, CD103-PE, CD127-PerCP-Cy5.5, CD45RO-PE-Cy7, CD27-APC-H7 and CD31-Alexa Fluor 647. The gating strategy to study CD4+CD45RA+RO−CD31+ (A) and CD8+CD45RA+RO−CD27+CD103+ (B) subsets is shown. A comparison of CD4+CD45RA+RO−CD31+ (C) or CD8+CD45RA+RO−CD27+CD103+ (D) subpopulations between baseline and week 24 post-treatment of all patients shows that only an increase in the CD8+CD45RA+RO−CD27+CD103+ subpopulation correlates with the increase of TREC levels in PBMC.

