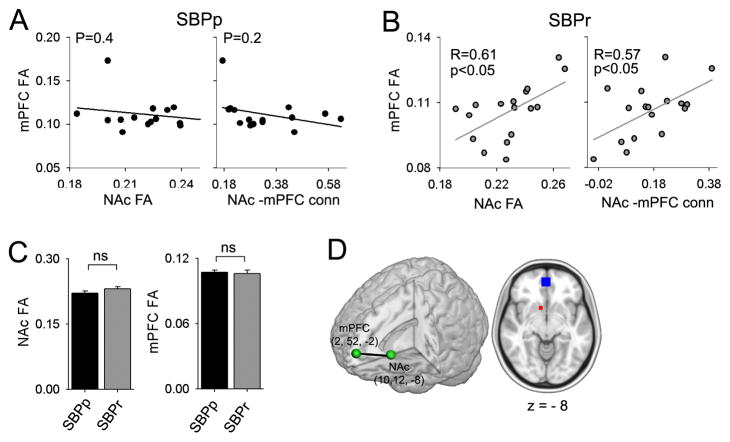
Figure 5. mPFC-NAc functional connectivity is differentially related to FA in mPFC.
(A) In SBPp, NAc FA does not correlate to mPFC FA; and NAc-mPFC functional connectivity does not correlate with FA in mPFC. (B) In SBPr, NAc FA positively correlated with mPFC FA; and NAc-mPFC functional connectivity also positively correlated with FA in mPFC. (C) Neither NAc FA nor mPFC FA were different across the two groups (t29=0.22, p=0.83 and t29=−1.41, p=0.17 for mPFC and NAc respectively). (D) Coordinates and size of regions from which mPFC-NAc functional connectivity and mean FA for NAc (red) and mPFC (blue) were calculated. These values are derived from our earlier study 9. Error bars represent S.E.M. ns = not significant.

