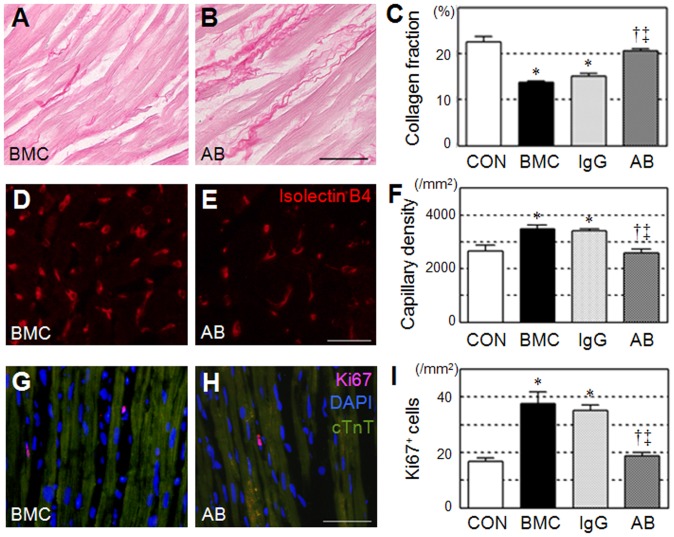
Figure 3. Eliminated BMC transplantation-induced tissue recovery by HMGB1-inhibition.
Reduced extracellular collagen deposition (A–C; picrosirius red = red), increased capillary density (D–F; Isolectin B4 = red), and increased proliferation (G–I; Ki67 = red; nuclei = blue; cTnT = green) were observed in the border areas at day 28 after BMC transplantation (BMC group), compared to the PBS control (CON group). These effects were all abolished by anti-HMGB1 antibody neutralization (AB group), but not by control IgG administration (IgG group). Representative images of only BMC and AB groups are present (see Figure S2 for additional images). Scale bars = 50 µm in A, B, G, H and 30 µm in D, E. *:p<0.05 versus the CON group, †:p<0.05 versus the BMC group, ‡:p<0.05 versus the IgG group, mean±SEM for n = 5∼7 in each group.

