
Figure 5.
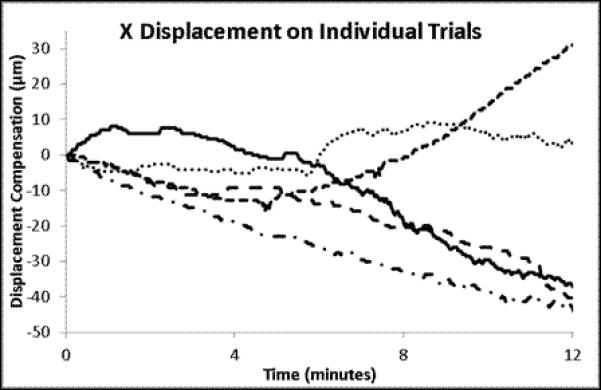
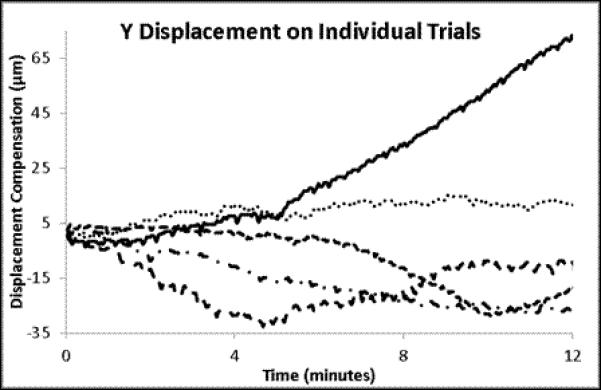
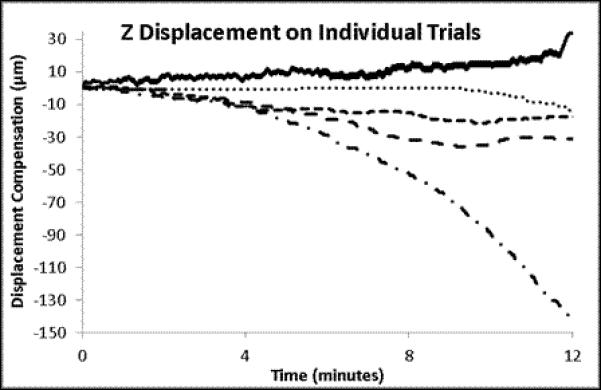
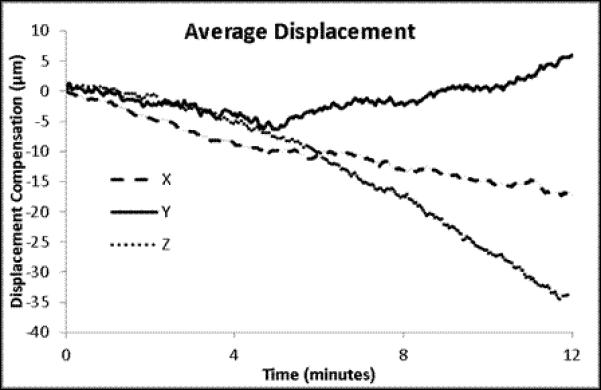
The individual and mean displacements for X, Y and Z for the time courses presented in Figure 4. The mean displacements are presented with the standard error of the means for the 5 trials.
Official websites use .gov
A
.gov website belongs to an official
government organization in the United States.
Secure .gov websites use HTTPS
A lock (
) or https:// means you've safely
connected to the .gov website. Share sensitive
information only on official, secure websites.
The individual and mean displacements for X, Y and Z for the time courses presented in Figure 4. The mean displacements are presented with the standard error of the means for the 5 trials.