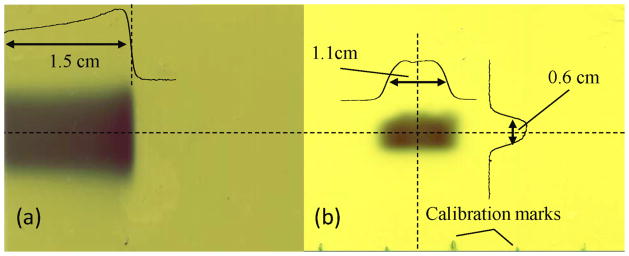
Figure 3.

EBT2 film measurements of (a) the proton Bragg peak in water and (b) the beam lateral fluence profile at the entrance of the sample container. Dashed lines indicate location of 1D depth dose and lateral profiles overlaid on the films. The distance to the 50% distal falloff of the Bragg peak in water was 1.5 cm and the FWHM of the lateral profiles were 1.1 cm and 0.6 cm, as indicated.
